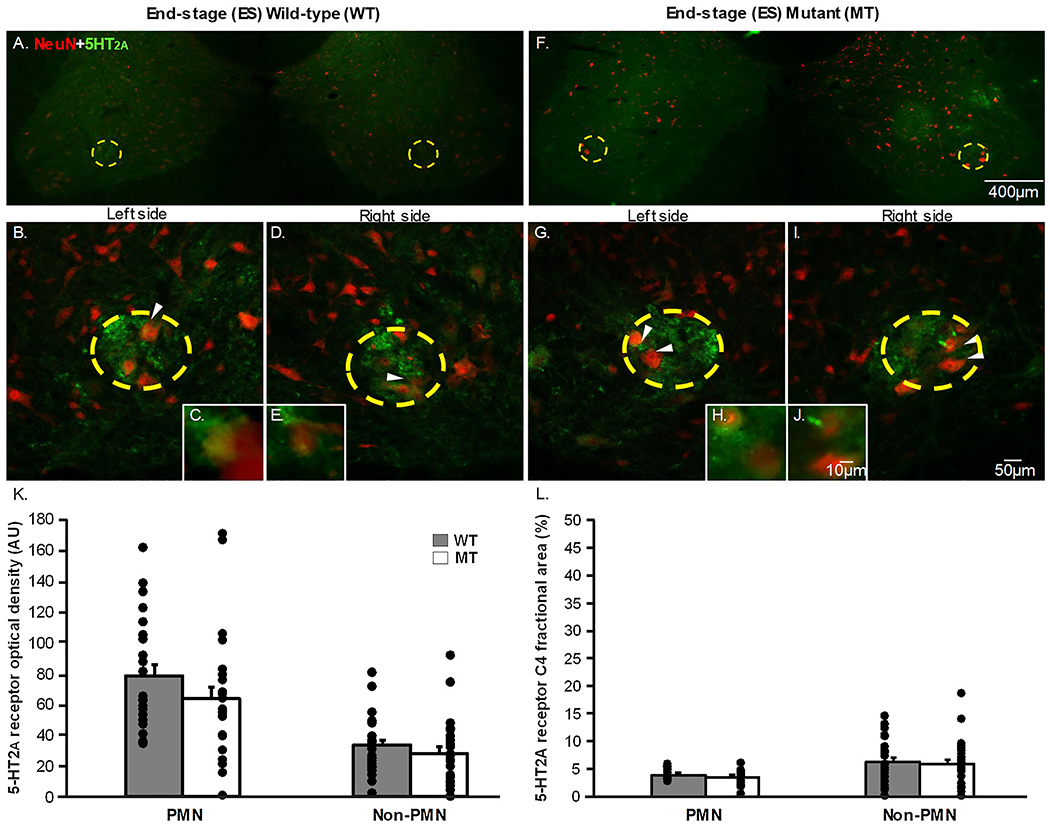
Figure 2: 5-HT2A receptor expression in the putative phrenic motor nucleus and non-phrenic ventral horn in end-stage wild-type and SOD1G93A mutant in C4 spinal cord sections.

The representative photomicrographs display motor neurons (NeuN; red) and 5-HT2A (green) receptor expression within the putative phrenic motor nucleus (yellow dashed circle) and the non-phrenic ventral horn (area outside of the yellow dashed circle) from rat C4 spinal cord sections in end-stage (ES; 2A-J) wild-type (WT; 2A-E) and SOD1G93A (Mutant; MT; 2F-I) rats at 4x (2A&F), 20x (2B,D,G,I), and 40x (2C,E,H,J) magnification. The white arrows in the 20x magnification images indicate what neurons are displayed in the 40x magnification images. 5-HT2A receptor expression is represented as optical density (AU; 2K) and fractional area (2L) in the putative phrenic motor nucleus and the non-phrenic ventral horn. Note, there were no significant differences in 5-HT2A optical density when comparing MT rats to age-matched WT littermates neither in the putative phrenic motor nucleus nor the non-phrenic ventral horn at ES (p>0.05).
