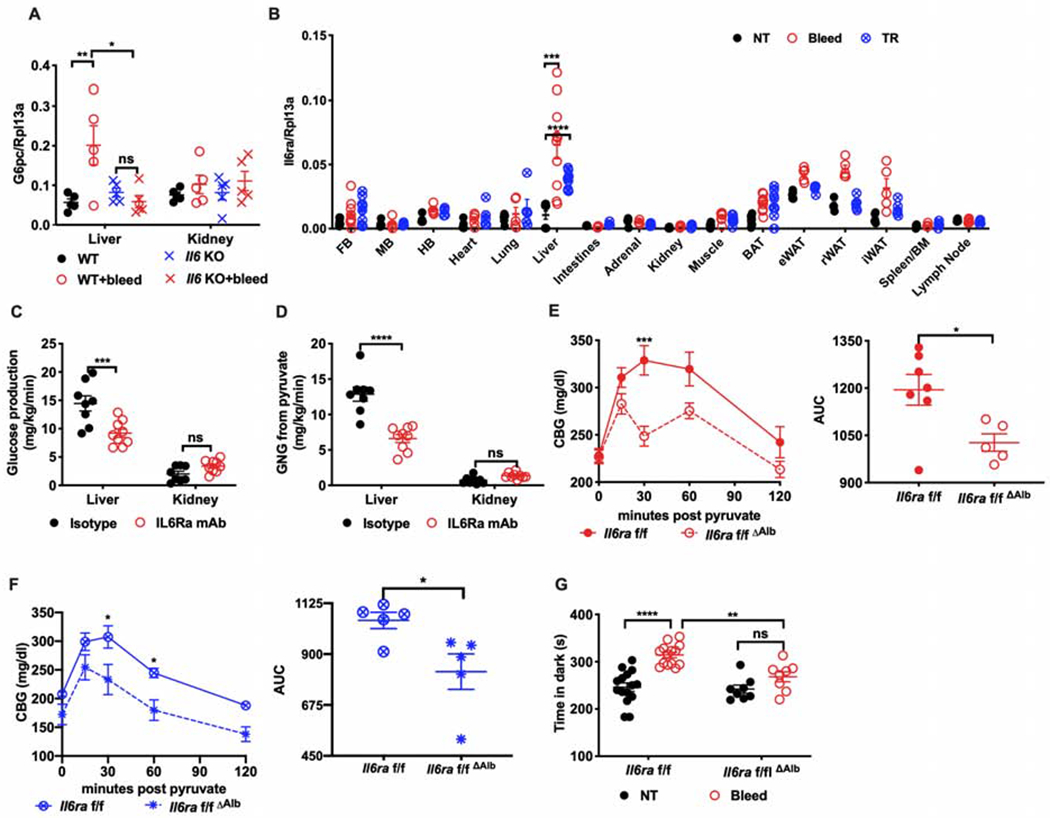
Figure 5. IL6 mediates stress hyperglycemia through hepatocyte reprogramming.

(A) G6pc mRNA in the liver and kidney of Il6 KO or WT mice four hours post bleeding (n=5 per group).
(B) Il6ra mRNA in the indicated tissues from stressed mice (n=5 per group, representative of 2 experiments)). FB, forebrain. MB, midbrain. HB, hindbrain. BAT, brown adipose tissue. eWAT, epididymal white adipose tissue. rWAT, retroperitoneal white adipose tissue. iWAT, inguinal white adipose tissue. NT, no treatment. TR, tube restraint.
(C) Rates of glucose production and (D) of gluconeogenesis from pyruvate in the liver or kidney of mice treated with IL6Ra inhibitor or isotype control (n=8 for isotype, n=9 for IL6Ra mAb).
(E) PTT four hours post bleeding or (F) tube restraint in mice with hepatocyte-specific deletion of Il6ra (Il6raf/fΔAlb) compared with littermate controls (Il6raf/f) (n=5 per group). AUC, area under the curve.
(G) Time in the dark using the light/dark box paradigm analyzed four hours post bleeding (bleed) from mice with hepatic deletion of Il6ra (Il6raf/fΔAlb) compared with littermate controls (Il6raf/f) (n=15 for Il6raf/f, n=9 for Il6raf/fΔAlb, representative of 3 experiments). * p<0.05, ** p<0.01, ***p<0.001, **** p<0.0001
See also Figure S4.
