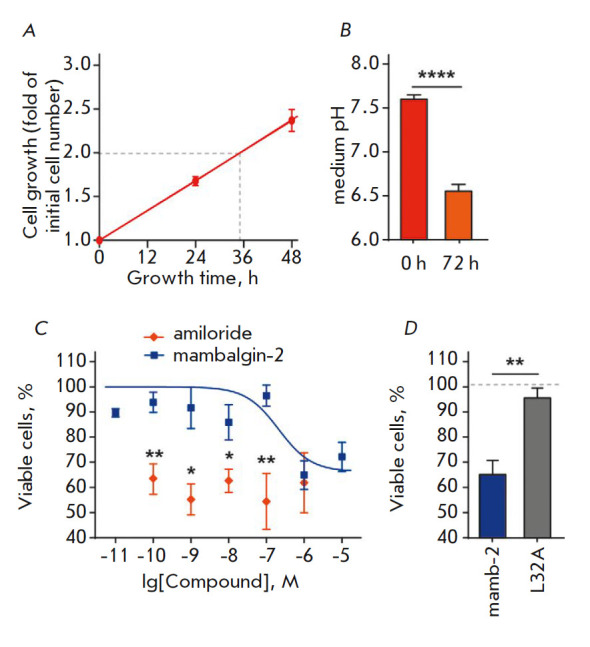
Fig. 2.

The effect of mambalgin-2 on the growth of the K562 cells. A – K562 cell growth without any substances, with medium change every day. The cell doubling time was calculated using linear regression. B – Changes in the medium pH upon incubation of cells for 72 h. Data are presented as pH ± SEM (n = 3); **** (p < 0.0001) indicates a significant difference between groups of data according to the two-tailed t-test. C – The effect of different mambalgin-2 concentrations on cell proliferation. Data are presented as % of the control (untreated cells) ± SEM (n = 3–6). * (p < 0.05) and ** (p < 0.01) indicate a significant difference between groups of data according to the two-tailed t-test. D – The antiproliferative activity of mambalgin-2 and its mutant variant, L32A. The data are presented as % of the control (untreated cells, dashed line) ± SEM (n = 3); ** (p < 0.01) indicates a significant difference between groups of data according to the two-tailed t-test
