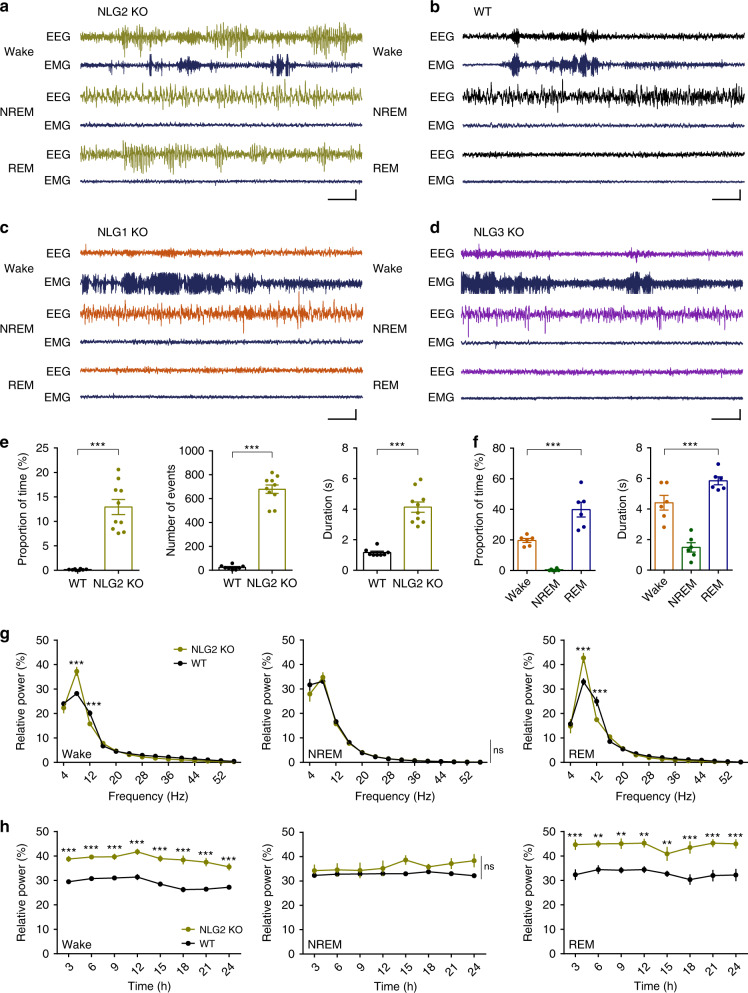
Fig. 1. NLG2 KO mice exhibit spontaneous SWDs and behavior arrests.
a–d Representative EEG and EMG traces showing SWDs in NLG2 KO (a), but not in WT (b), NLG1 KO (c), and NLG3 KO mice (d). Scale bars: 2 s/100 μV. e Averaged EEG recordings (3 h light period and 3 h dark period) showing increased SWD proportion (p < 0.0001), number (p < 0.0001), and duration (p < 0.0001) in NLG2 KO (n = 10) compared to WT mice (n = 8). Two-sided t-test. f Averaged EEG recordings (3 h light period and 3 h dark period) showing predominant presence of SWDs in the wake and REM sleep in NLG2 KO mice (proportion of time: p < 0.0001, n = 6; duration: p < 0.0001, n = 6; one-way ANOVA). g Relative power of various EEG frequencies showing significant genotype-frequency interactions (repeated two-way ANOVA) for the wake (p = 0.0001, WT: n = 6, NLG2 KO: n = 8, post-hoc Holm–Sidak’s comparisons: p < 0.0001 for the 5–8 Hz bin, p = 0.0004 for the 9–12 Hz bin) and REM sleep (p < 0.0001, WT: n = 6, NLG2 KO: n = 7, post-hoc Holm–Sidak’s comparisons: p < 0.0001 for the 5–8 Hz bin, p < 0.0001 for the 9–12 Hz bin), but not for the NREM sleep (p = 0.7788, WT: n = 6, NLG2 KO: n = 8). h Relative power of theta activity (5–8 Hz bin) over the 24 h EEG recordings showing significant genotype effect (repeated two-way ANOVA) for the wake (p < 0.0001, WT: n = 6, NLG2 KO: n = 7, post-hoc Holm–Sidak’s comparisons: significant at each time point) and REM sleep (p = 0.0003, WT: n = 5, NLG2 KO: n = 6, post-hoc Holm–Sidak’s comparisons: significant at each time point), but not for the NREM sleep (p = 0.0897, WT: n = 5, NLG2 KO: n = 7). Data in e–h represent mean ± SEM. **p < 0.01, ***p < 0.001. ns nonsignificant. Source data are provided as a Source Data file.

