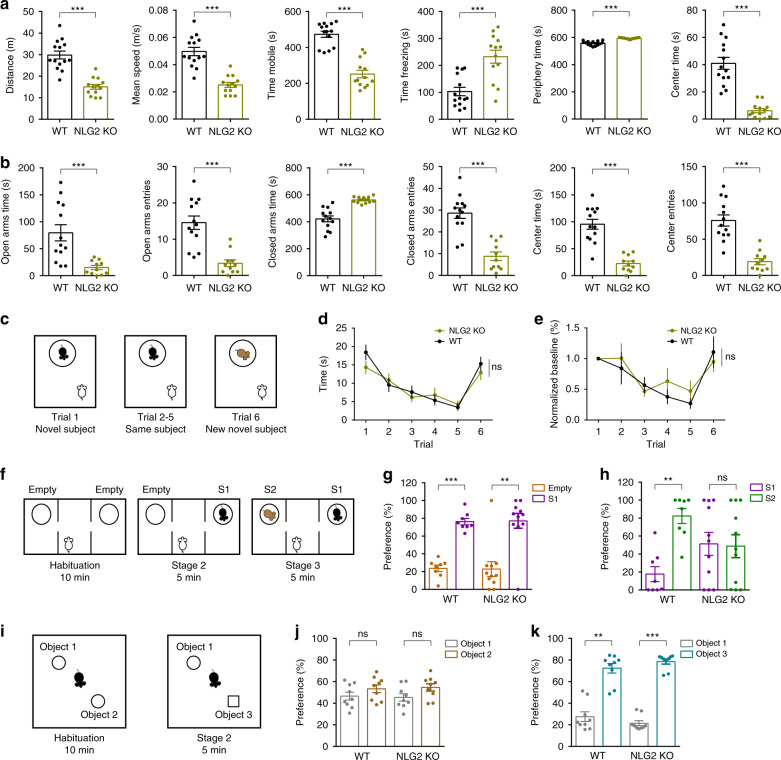
Fig. 4. Reduced locomotion, increased anxiety, and impaired social memory in NLG2 KO mice.
a Open field test showing decreased travel distance (p < 0.0001), travel speed (p < 0.0001), and mobile time (p < 0.0001), increased freezing time (p < 0.0001), increased time spent in periphery zone (p < 0.0001), and decreased time spent in center zone (p < 0.0001) in NLG2 KO (n = 13) compared with WT mice (n = 14). b Elevated plus maze test showing decreased time spent in open arms (p = 0.0009), decreased open arms entries (p < 0.0001), increased time spent in closed arms (p < 0.0001), decreased closed arm entries (p < 0.0001), decreased time spent in center (p < 0.0001), and decreased center entries (p < 0.0001) in NLG2 KO (n = 11) compared with WT mice (n = 13). c Schematic diagram of the five-trial habituation/dishabituation assay. d Summary data of the five-trial assay showing similar memory acquisition during trials 1–5 and preference for a novel mouse in trial 6 (two-way ANOVA, p = 0.4640) in WT (n = 18) and NLG2 KO mice (n = 18). e Normalized interaction time of (d) showing no differences (two-way ANOVA, p = 0.5322) between WT (n = 18) and NLG2 KO (n = 18) mice. f Schematic diagram of the three-chamber social interaction test. g Normalized interaction time showing similar preference for S1 over empty cage during stage 2 of the three-chamber social test in WT (n = 8) and NLG2 KO mice (n = 11) (WT: p = 0.0002, NLG2 KO: p = 0.0083). h Impaired preference for S2 over S1 during stage 3 of the three-chamber social interaction test in NLG2 KO (n = 11) compared to WT mice (n = 8) (WT: p = 0.0061, NLG2 KO: p = 0.9237). i Schematic diagram of the novel object recognition test. j Novel object recognition test showing similar preference for object 1 and object 2 in WT (n = 9) and NLG2 KO mice (n = 9) (WT: p = 0.3748, NLG2 KO: p = 0.2149). k Increased preference for object 3 over object 1 during stage 2 in both WT (n = 9) and NLG2 KO mice (n = 9) (WT: p = 0.001, NLG2 KO: p < 0.0001). Data in a, b, d, e, g, h, j, and k represent mean ± SEM. Two-sided t-test was used for data in a, b, g, h, j, and k. *p < 0.05, **p < 0.01, ***p < 0.001. ns nonsignificant. Source data are provided as a Source Data file.

