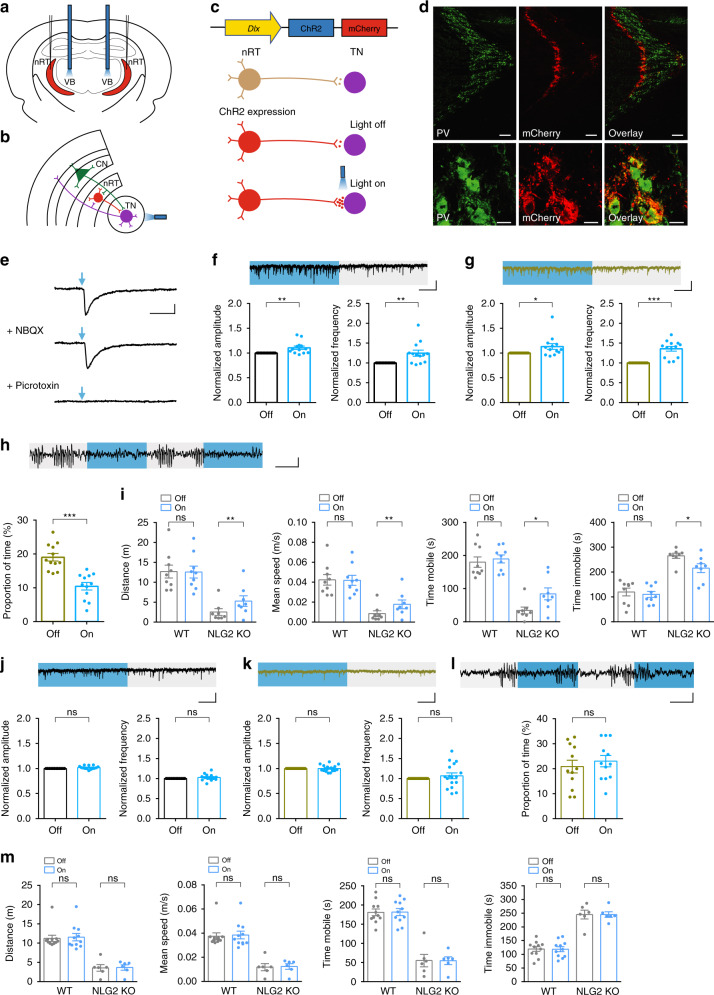
Fig. 6. Optical activation of the nRT-thalamic circuit reduces synaptic and behavior deficits in NLG2 KO mice.
a Optical fiber location in ventrobasal thalamus (VB) and virus injection site in nRT. b Schematic of the optical stimulation of the nRT-thalamic circuit. CN cortical neuron, TN thalamic neuron. c Viral ChR2-mCherry construct, expression and optical activation of the nRT-thalamic terminal. d Immunostaining images of ChR2-mCherry (red) and PV+ neurons (green) in the nRT region. Scale bars: 100 μm (top), 10 μm (bottom). Images are representatives of three replicates. e Whole-cell recording of thalamic neurons of ChR2-mCherry infected mice, showing IPSCs evoked by the 455 nm blue-light illumination (1 ms) and blocked by picrotoxin but not NBQX and APV. Scale bar: 20 ms/100 pA. f Increased sIPSC amplitude (p = 0.0098) and frequency (p = 0.0074) with blue-light on compared to blue-light off in WT mice injected with ChR2-mCherry viruses (n = 13). Scale bar: 1 s/20 pA. g, Increased sIPSC amplitude (p = 0.0418) and frequency (p < 0.0001) with blue-light on compared to blue-light off in NLG2 KO mice injected with ChR2-mCherry viruses (n = 13). Scale bar: 1 s/20 pA. h Decreased SWDs with blue-light on compared to blue-light off in NLG2 KO mice (n = 12) injected with ChR2-mCherry viruses (p < 0.0001). Scale bar: 2 s/100 μV. i Increased travel distance (p = 0.0040), speed (p = 0.0026), mobile time (p = 0.0197), and decreased immobile time (p = 0.0198) with alternate 5 s blue-light on and off compared to blue-light off in NLG2 KO mice injected with ChR2-mCherry viruses (n = 8). j Similar sIPSC amplitude (p = 0.0695) and frequency (p = 0.2639) with blue-light on compared to blue-light off in WT mice (n = 14) injected with GFP control viruses. Scale bar: 1 s/20 pA. k Similar sIPSC amplitude (p = 0.9756) and frequency (p = 0.3797) with blue-light on compared to blue-light off in NLG2 KO mice (n = 17) injected with GFP control viruses. Scale bar: 1 s/20 pA. l Similar SWDs with blue-light on compared to blue-light off (p = 0.1978)) in NLG2 KO mice (n = 12) injected with GFP control viruses. Scale bar: 2 s/100 μV. m Similar travel distance (WT: p = 0.812, NLG2 KO: p = 0.8903), speed (WT: p = 0.8254, NLG2 KO: p = 0.86), mobile time (WT: p = 0.9461, NLG2 KO: p = 0.9796), and immobile time (WT: p = 0.9454, NLG2 KO: p = 0.9807) with alternate 5 s blue-light on and off compared to blue-light off in WT (n = 11) and NLG2 KO mice (n = 6) injected with GFP control viruses. Data in f–m represent mean ± SEM. *p < 0.05, **p < 0.01, ***p < 0.001 with two-sided paired t-test. ns nonsignificant. Source data are provided as a Source Data file.

