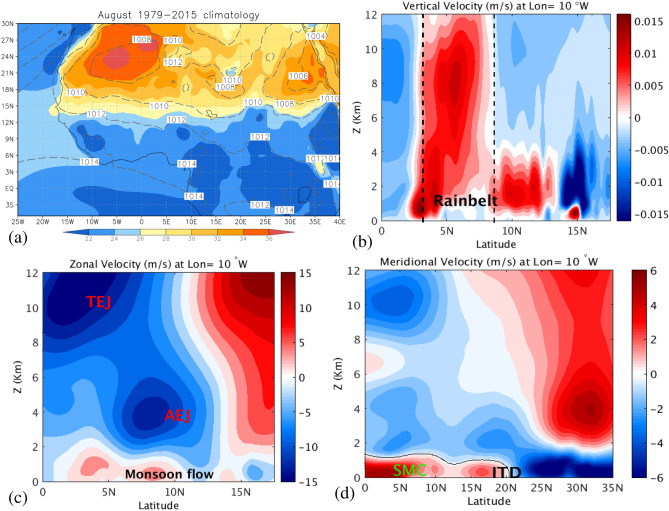
Figure 1.
(a) Climatology of 2 m temperature (shaded, in °C) and mean sea level pressure (contour, in hPa) of ERA-Interim averaged for the month of August in the 1979–2015 period. Velocities at 10° W in m/s. (b) Vertical velocity component: positive (negative) values are updraft (downdraft) winds; (c) Zonal velocities: positive (negative) values are westerly (easterly) wind; (d) Meridional velocities: positive (negative) values indicate southerly (northerly) wind. All these data are averaged for the month of August over the 1979–2015 period. The rainbelt band located between 5° N and 15°N is represented in plot (b). In addition, the approximative location of the Tropical Easterly Jet (TEJ), the African Easterly Jet (AEJ) and the monsoon flow are labeled in plot (c) while the southerly Shallow Meridional Cell (SMC) and the InterTropical Discontinuity (ITD) are shown in plot (d). Map in panel (a) is done with Grid Analysis and Display System (GrADS) Version 2.2.0. The URL is http://cola.gmu.edu/grads/.

