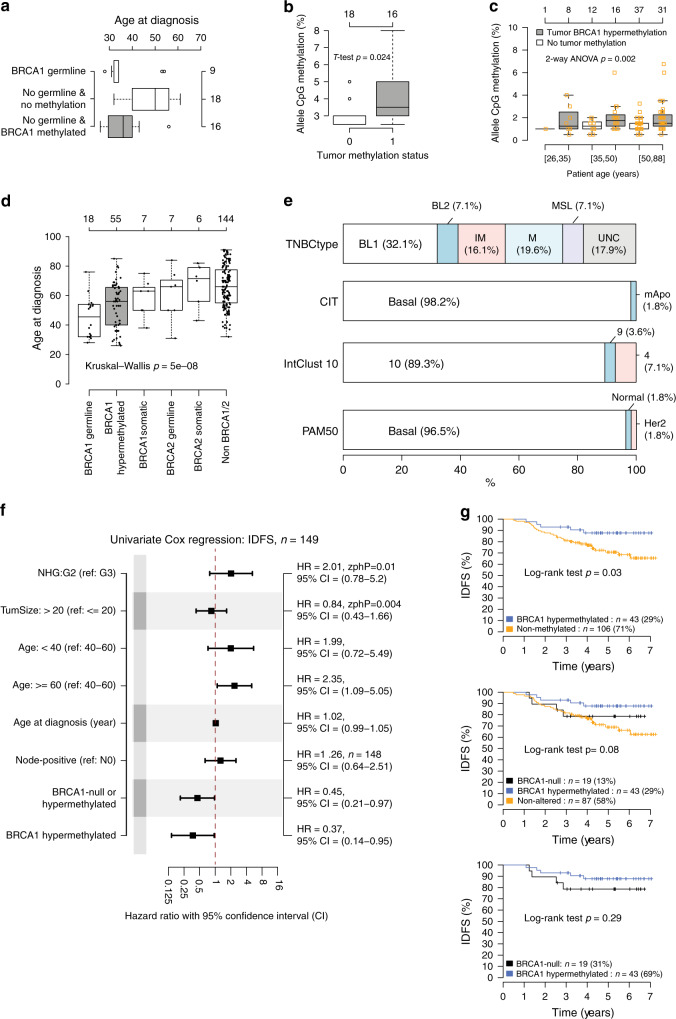
Fig. 3. BRCA1 methylation in peripheral blood, gene expression subtypes, and prognosis after therapy.
a Distribution of age at diagnosis for 43 germline screened SCAN-B patients harboring germline BRCA1 loss of function variants (n = 9) or no germline variants (n = 34) further stratified by tumor BRCA1 hypermethylation status. b BRCA1 CpG allele methylation frequency in matched peripheral blood DNA from non-germline SCAN-B patients stratified by their tumor methylation status (methylated = 1) from panel (a). c BRCA1 CpG allele methylation frequency in peripheral blood DNA from a combined analysis of 105 SCAN-B cases analyzed using the same instrument settings and reagent lots, including 55 of 57 hypermethylated cases, and stratified by patient age and tumor methylation status. Hard brackets ([]) imply ≥ or ≤, respectively. d Age at diagnosis for 237 SCAN-B patients stratified by BRCA1 and BRCA2 status. The number of methylated cases is less than 57 as two cases have concurrent BRCA2 mutations (one germline, one somatic nonpathogenic). e Molecular subtype proportions in BRCA1 hypermethylated SCAN-B cases for PAM50, CIT, IntClust 10, and TNBCtype. CIT subtypes29; mApo, molecular apocrine. IntClust 10 subtypes62; cluster 10 corresponding to basal-like tumors by other subtyping schemes. TNBCtype subtypes31; BL1, basal-like 1: BL 2, basal-like 2: IM, immunomodulatory: M, mesenchymal: MSL, mesenchymal stem-like: LAR, luminal androgen receptor: UNC, uncertain. f Univariate Cox regression using invasive disease-free survival (IDFS) as clinical endpoint for different variables in 149 SCAN-B patients eligible for outcome analysis after standard of care adjuvant chemotherapy. HR: hazard ratio. NHG: grade, G2 equals grade 2, G3 equals grade 3. N0: node-negative. A Zph p value < 0.05 corresponds to that the proportional hazard assumption is not fulfilled. An (n =) indication in the right axis indicates that not all 149 cases were used due to missing values. g Kaplan–Meier analysis using IDFS as clinical endpoint for SCAN-B patients eligible for outcome analysis after adjuvant chemotherapy. Top panel shows the 149 patients stratified by BRCA1 hypermethylation status alone, center panel shows stratification including also BRCA1-null cases, and bottom panel a comparison between only hypermethylated and BRCA1-null patients. All p values reported from statistical tests are two-sided. Source data are provided as a Source Data file.

