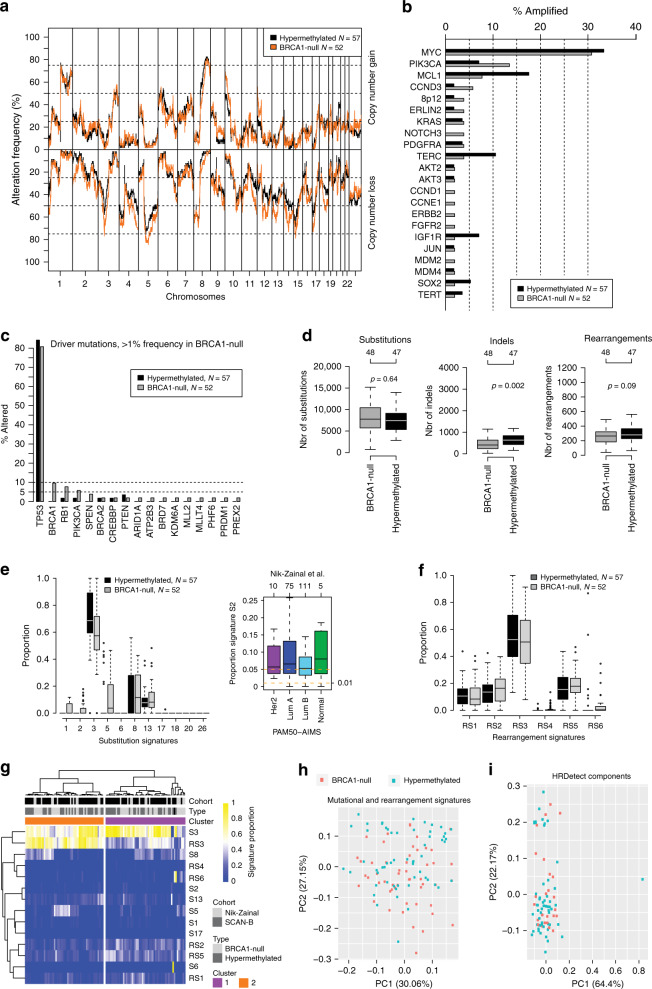
Fig. 4. Genetic phenotypes of BRCA1 hypermethylated and BRCA1-null TNBC.
The 57 hypermethylated and 25 BRCA1-null SCAN-B cases were combined with 27 BRCA1-null cases from Nik-Zainal et al.24. a Frequency of copy number alterations across the genome for BRCA1 hypermethylated and BRCA1-null cases. b Frequency of copy number amplification for driver genes defined in Nik-Zainal et al.24. c Frequency of mutations (insertions, deletions, substitutions) for driver genes defined in Nik-Zainal et al.24. Only genes with >1% alteration in the BRCA1-null cohort are shown. Displayed mutations in BRCA1 are somatic. d Total number of substitutions, indels, and rearrangements per sample for BRCA1 hypermethylated versus BRCA1-null groups. Only cases sequenced to at least 30-fold depth included. p Values calculated using Wilcoxon’s test. Top axes show number of cases per group. e Left panel shows distribution of mutational signature (defined in Nik-Zainal et al.24) proportions per sample between hypermethylated versus BRCA1-null cases. Proportions are calculated as the number of substitutions for a signature divided by the total number of substitutions from all signatures. Right panel shows proportion of the APOBEC Substitution Signature 2 in non-basal-like tumors from Nik-Zainal et al.24. Top axis indicates number of samples per group. All outliers are not shown due to y-axis scale. f Distribution of rearrangement signature24 proportions per sample between hypermethylated and BRCA1-null cases. g Hierarchical clustering of combined substitution and rearrangement signature proportions using Pearson correlation and Ward.D linkage in the 109 combined cases. h Principal component analysis of proportions of substitution and rearrangement signatures in the 109 combined cases, illustrated by the first two principal components representing most variation. i Principal component analysis of the proportions of the contributions of HRDetect components (as defined in ref. 26) per sample (obtained from22), illustrated by the first two principal components representing most variation. The analysis only included the 25 BRCA1-null and 57 hypermethylated SCAN-B cases. All p values reported from statistical tests are two-sided. Source data are provided as a Source Data file.

