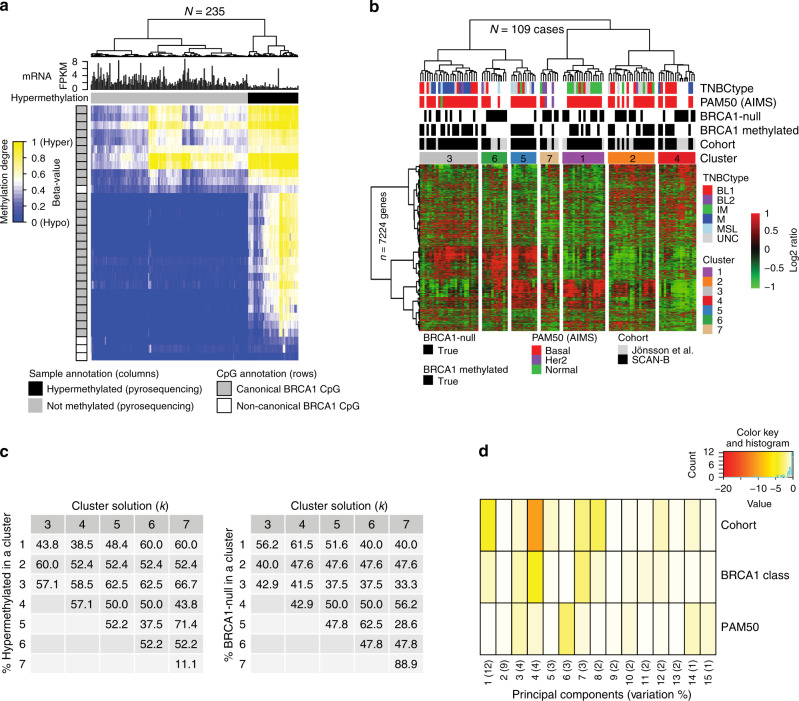
Fig. 5. DNA methylation and transcriptional characteristics in BRCA1 hypermethylated and BRCA1-null TNBC.
a Hierarchical clustering (ward.D2 linkage, Euclidean distance) of DNA methylation data (beta-values, heatmap) from 235 SCAN-B cases for 32 CpGs associated with the BRCA1 gene. The 32 CpGs were differentially methylated between 25 BRCA1-null and 57 BRCA1 hypermethylated SCAN-B cases through supervised analysis of Illumina EPIC data. Black sample annotations correspond to hypermethylated cases by pyrosequencing, gray to unmethylated. Gray CpG annotation bars (rows) indicate belonging to the canonical BRCA1 promoter (+500 to −1500 base pairs, chr17:43124984–43126983). BRCA1 mRNA expression (FPKM) is shown for each case as bar plot expression above the CpG heatmap. b Unsupervised hierarchical gene expression-based clustering of 52 BRCA1-null and 57 BRCA1 hypermethylated cases combined from the SCAN-B and Jönsson et al.23 cohorts using Pearson correlation as distance and Ward.D linkage based on 7224 genes with standard deviation >0.6 in mean-centered expression across all samples. Colored boxes indicate the seven top subclusters defined from the hierarchical tree. TNBCtype subtypes31; BL1, basal-like 1: BL 2, basal-like 2: IM, immunomodulatory: M, mesenchymal: MSL, mesenchymal stem-like: UNC, uncertain. PAM50 and TNBCtype subtypes were not available for the Jönsson et al. cases. c Summarized results from consensus clustering, using a range between 3 and 7 cluster solutions (k, columns) and the same gene set and samples as in (b). For each cluster solution, the percentage of BRCA1 hypermethylated (left matrix) and BRCA1-null (right matrix) cases in the different defined clusters are shown (rows). d Principal component analysis based on the expression of the 7224 genes to relate variance in gene expression with BRCA1 status. A more intense red color for a principal component (columns) with a variable (rows) implies a stronger association with variance in expression for that component. Components represent variation in decreasing strength (first component largest variation with contributed percentage variation listed). A variable strongly associated with variation in expression is thus represented by an intense red principal component capturing a high percentage of the variation. All p values reported from statistical tests are two-sided. Source data are provided as a Source Data file.

