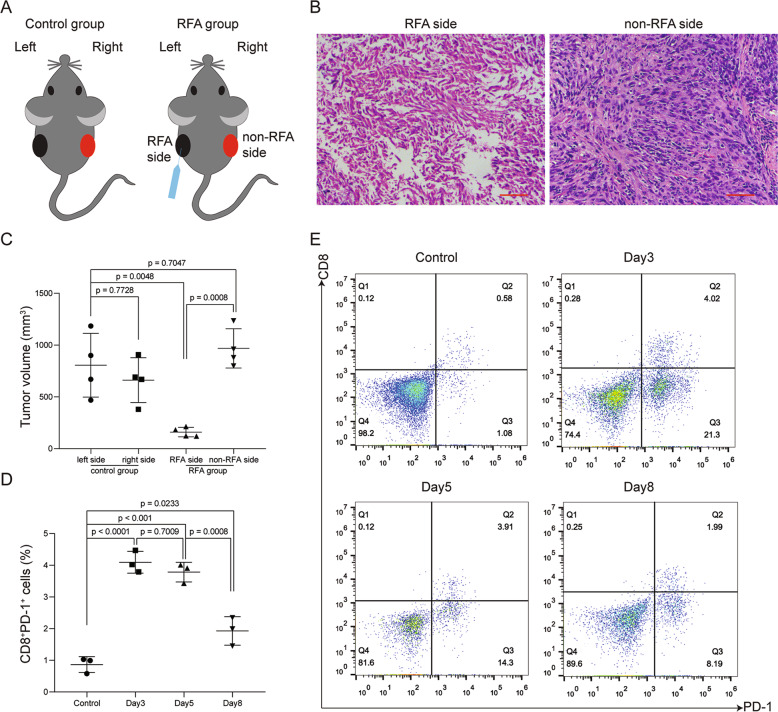
Fig. 1. Changes in distant non-RFA tumor after RFA treatment.
a Diagram of control group and RFA group. RFA treatment was performed on the left side tumors (RFA side). The right side (non-RFA side) tumors were used to further analysis. b H&E staining of tumor tissues on RFA and non-RFA side after RFA treatment. Scale bar = 50 μm (red line at the bottom right). c After 2 weeks, tumors from control group and RFA group were harvested and measured. Tumor volumes were compared to each two groups. p values were calculated based on a Student’s t test (n = 4 per group). d, e Percentage of CD8+PD-1+ cells in distant non-RFA tumor on day 3, 5, and 8 after RFA treatment. p values were calculated based on a Student’s t test (n = 3 per group).

