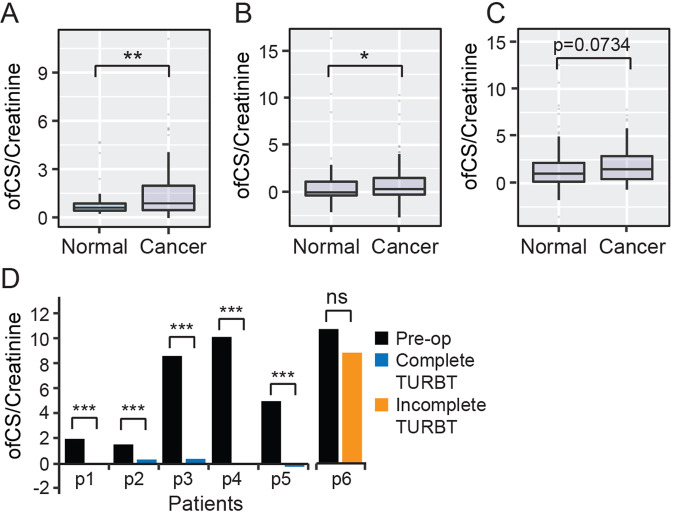
Fig. 3. Validation of ofCS expression in different cohorts.
a Expression analysis of ofCS between cancer-free individuals (normal) and bladder cancer patients in the UK cohort (n = 100) was carried out using the methods described previously and all data were analyzed using R. b Expression analysis of ofCS between cancer-free individuals and bladder cancer patients in the Spain cohort (n = 136). c Expression analysis of ofCS between cancer-free individuals and bladder cancer patients at the time of urine collection in the Tubingen Cohort (n = 198). d Urine samples of patients (n = 6) before and after treatment (tumor resection or cystectomy) were measured for ofCS expression and compared. Boxes represent the 25th to 75th percentile with means at the 50th percentile and whiskers extend to the highest and lowest values within 1.5× of the upper and lower quartile distance with outliers shown as dots. Mann–Whitney test: ***p < 0.001.

