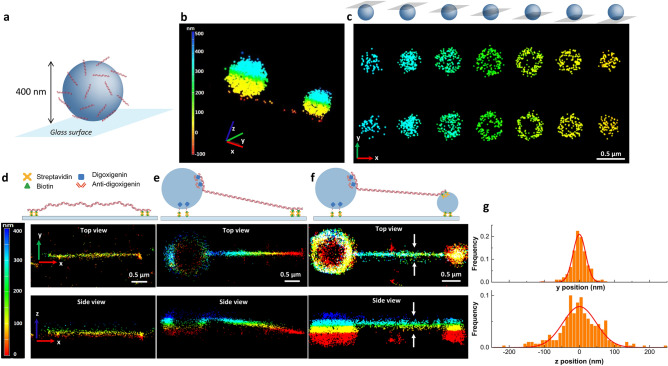
Figure 2.
3D BALM imaging of DNA. (a) A cartoon depiction of a DNA-coated bead immobilized on a glass surface through biotin-streptavidin linkage. (b, c) 3D BALM images (b) and the corresponding cross sections of two DNA-coated microspheres at different axial levels (c) with color-coded height map. The schematics above c illustrate different z levels. (d)–(f) 3D BALM images of 10 kb linear dsDNA tethered to the surface of the glass at both ends (d), tethered to the surface at one end and to a 1-µm diameter bead at the other end (e), tethered to a 1-µm diameter bead at one end and to a 0.4-µm diameter bead at the other end (f). (g) Line profile for determination of lateral and axial FWHM (representing dsDNA, tethered to a 1-µm diameter bead from one end and to a 0.4-µm diameter bead from the other end). Solids lines are fits to a Gaussian.

