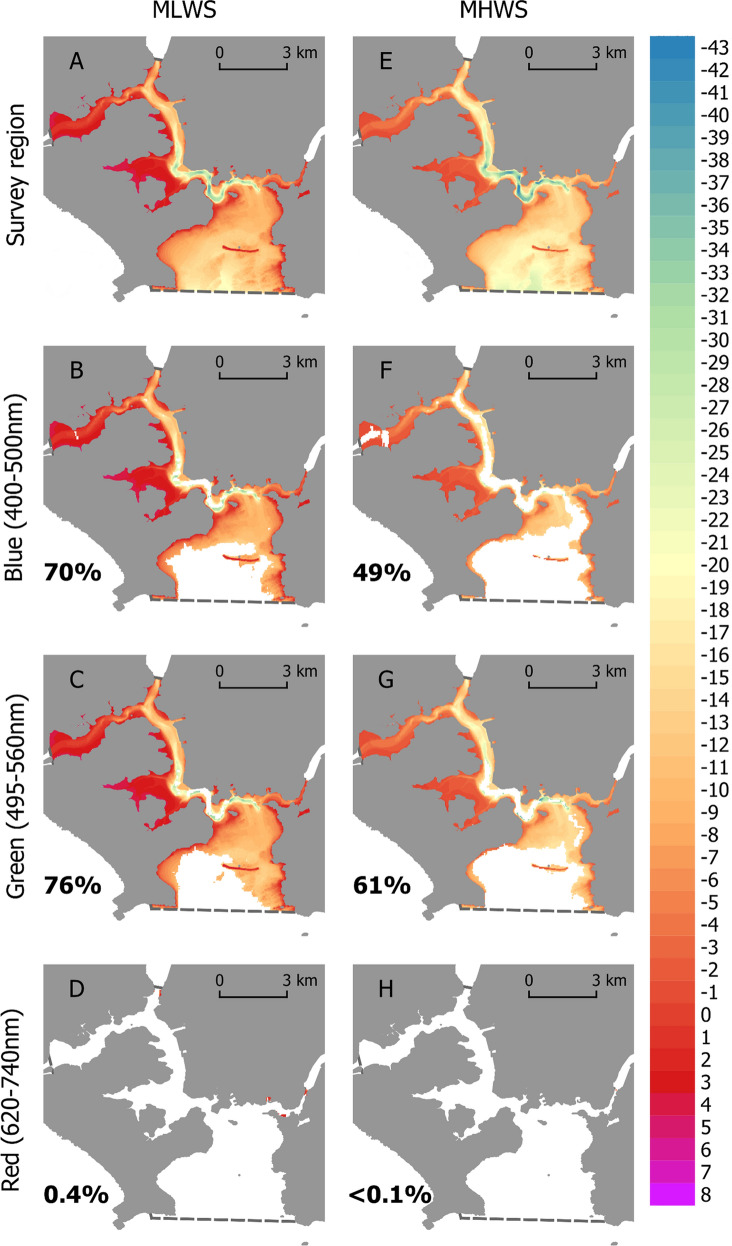
Figure 3.
The three dimensional area of seafloor exposed to ‘biologically important’ blue (B,F), green (C,G) and red (D,H) artificial light at night at Mean Low Water Spring (MLWS) and Mean High Water Spring (MHWS) tide in Plymouth Sound and the Tamar Estuary under cloudy conditions. Legend indicates bathymetric depth (m) at the given datums. White space within the survey region (dashed line) indicates exposure at ALAN irradiances below the biological threshold. Numbers inset indicate the percentage of the 3D seafloor region (A,E) exposed. Maps created in QGIS v3.4 (https://qgis.org).

