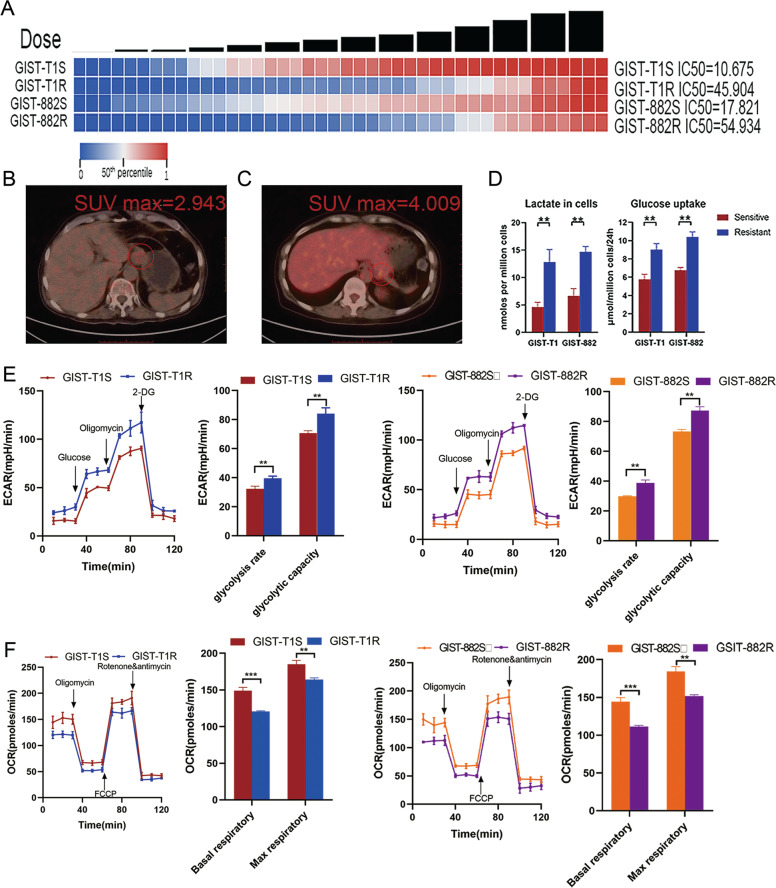
Fig. 1. IM resistant cells have increased glycometabolism activity GIST.
a Heatmaps representing cell viability after treatment of IM. b 18FDG-PET-CT performed in a 52-year-old man. Transaxial fused image showing mild tracer uptake in the tumor (abnormal finding, circled). c 18FDG-PET-CT performed in a 58-year-old man who relapsed after complete resection of tumor 10 months ago and treatment of IM 400 mg/day for 9 months. Transaxial fused image showing focal tracer uptake in the tumor (abnormal finding, circled). d Lactate, and glucose uptake analysis of GIST cell lines were determined via flow cytometry and the colorimetric method, respectively. e Analysis of extracellular acidification rate of GIST-T1 cells (left) and GIST-882 cells (right). The extracellular acidification rate after glucose treatment indicates the rate of glycolysis. The extracellular acidification rate after oligomycin treatment indicates the glycolytic capacity. f Analysis of oxygen consumption rate of GIST-T1 cells (left) and GIST-882 cells (right). The oxygen consumption rate before oligomycin treatment indicates the basal respiratory rate. The oxygen consumption rate after FCCP treatment indicates the maximum respiratory rate. The error bars represent the mean (n = 3) ± S.D. *P < 0.05, **P < 0.01, ***P < 0.001.

