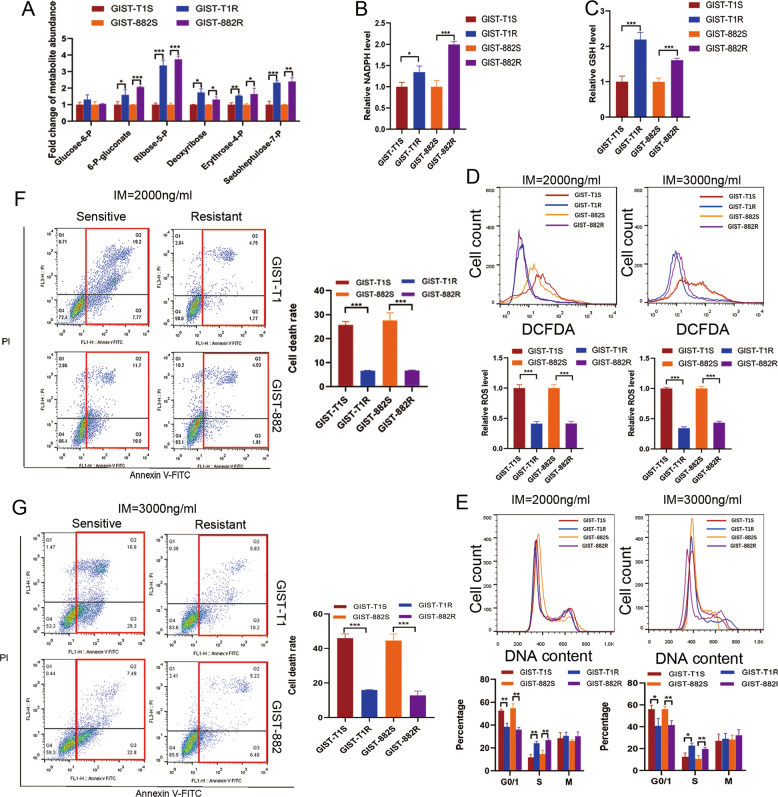
Fig. 3. Analysis of the effect of PGD in PPP on ROS production and cell cycle arrest induce by IM in GIST.
a Targeted analysis of abundance of different metabolites in PPP. b NADPH levels in GIST cells. c GSH levels in GIST cells. d FACS analysis (above) and statistical results (below) of ROS levels after treatment with 2000 ng/ml or 3000 ng/ml for 24 h. e DNA content analysis of GIST cells after exposed to IM with 2000 ng/ml or 3000 ng/ml for 24 h. f FACS analysis of cell apoptosis after exposed to IM with 2000 ng/ml for 24 h. g FACS analysis of cell apoptosis after exposed to IM with 3000 ng/ml for 24 h. The error bars represent the mean (n = 3) ± S.D. *P < 0.05, **P < 0.01, ***P < 0.001.

