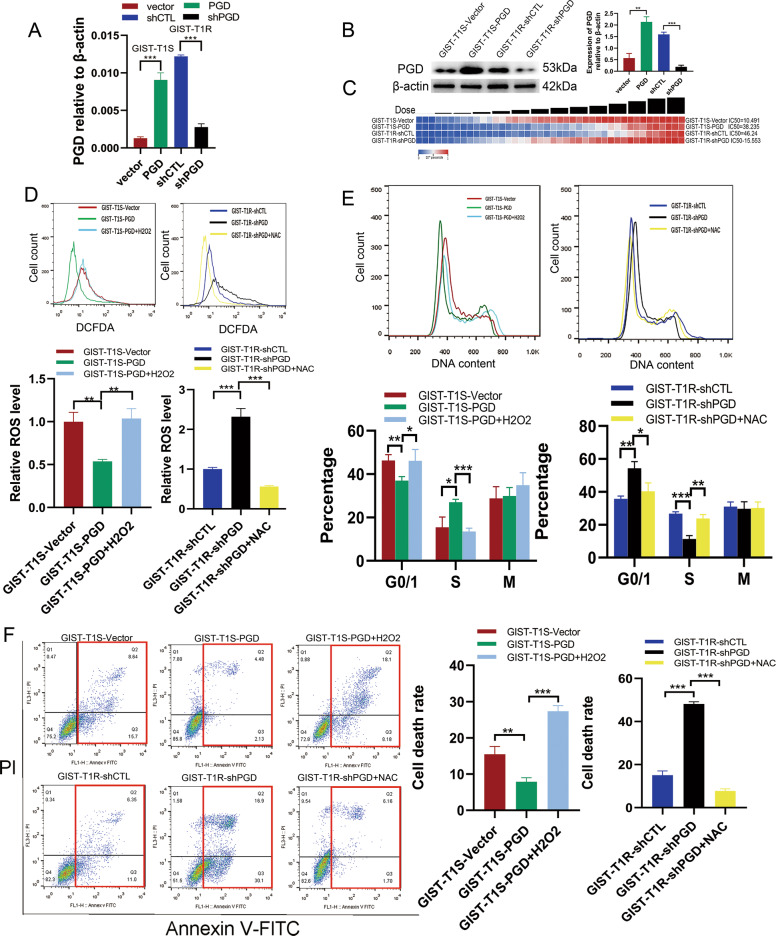
Fig. 4. ROS reverse the resistance of GIST cells with high expression of PGD in vitro.
a PGD expression levels were evaluated by qRT-PCR after PGD overexpression and knockdown in GIST-T1S and GIST-T1R cells, respectively. b PGD expression levels were evaluated by WB after PGD overexpression and knockdown in GIST-T1S and GIST-T1R cells, respectively. c Resistant capacity were evaluated by IC50 after PGD overexpression and knockdown in GIST-T1S and GIST-T1R cells, respectively. d FACS analysis (above) and statistical results (below) of ROS levels of GIST-T1S-vector, T1S-PGD, T1R-shCTL, T1R-shPGD, 10 mM NAC or 20 μM H2O2 for 24 h. e DNA content analysis (above) and statistical results (below) of GIST-T1S-vector, T1S-PGD, T1R-shCTL, T1R-shPGD, 10 mM NAC or 20 μM H2O2 for 24 h. f FACS analysis of cell apoptosis (above) and statistical results (below) of GIST-T1S-vector, T1S-PGD, T1R-shCTL, T1R-shPGD, 10 mM NAC or 20 μM H2O2 for 24 h. The error bars represent the mean (n = 3) ± S.D. *P < 0.05, **P < 0.01, ***P < 0.001.

