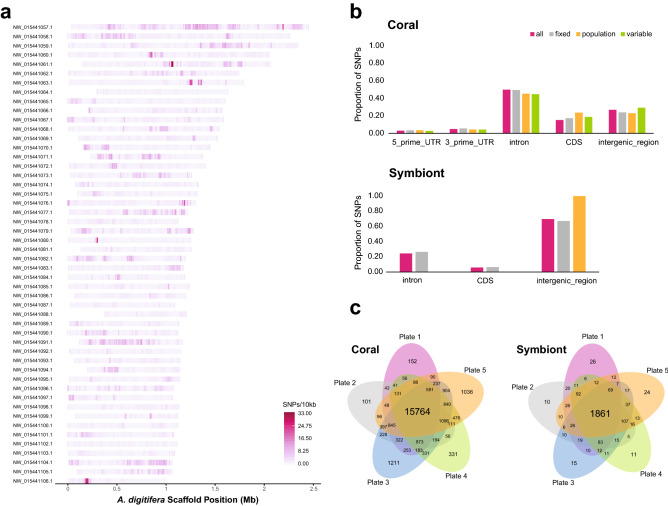
Figure 2.
Density, distribution and recovery of SNP probes. The probe density over 10,000 bp windows is mapped onto the 50 longest A. digitifera reference scaffolds (a). The highest density exceeds 33 probes in a given interval, where most intervals are between 0 to 8 probes. The proportion of designed probes are compared for coding and non-coding regions in the genomes of the coral and symbionts (b). All probes are pink, fixed probes are grey, population probes are orange, and variable probes are green. The recommended probes shared between each plate are shown in the Venn diagrams (c).

