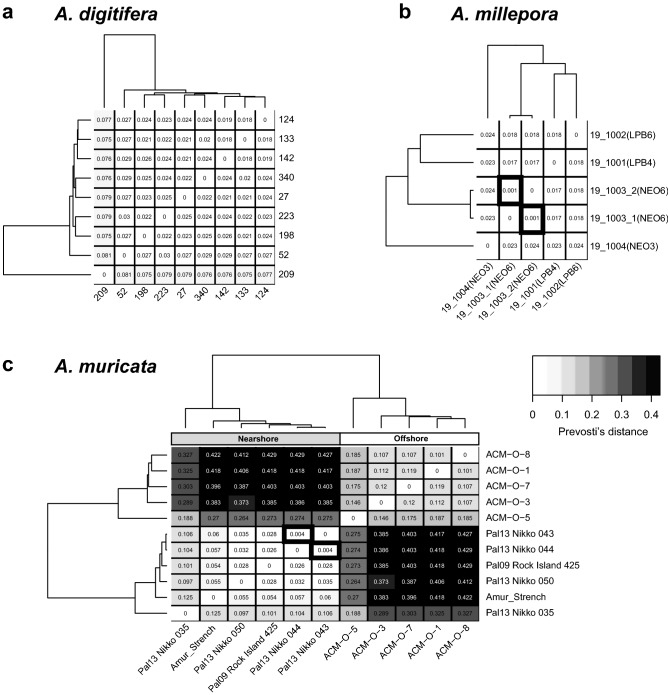
Figure 6.
Genetic distance of Pacific acroporids using 1,779 shared probes. The relatedness of samples from three Pacific species, A. digitifera (a), A. millepora (b) and A. muricata (c) were compared using Prevosti’s genetic distance. The distance for each pairwise sample combination is displayed in the respective square of the heatmap. The darker the shading, the larger the genetic distance between samples. The dendrogram on the top and side represents the hierarchical clustering of the samples based on genetic relatedness. Samples with thick black borders are nearly identical for the probes tested and are likely the same genet. In the case of A. muricata (c), clear separation is observed of nearshore and offshore samples.

