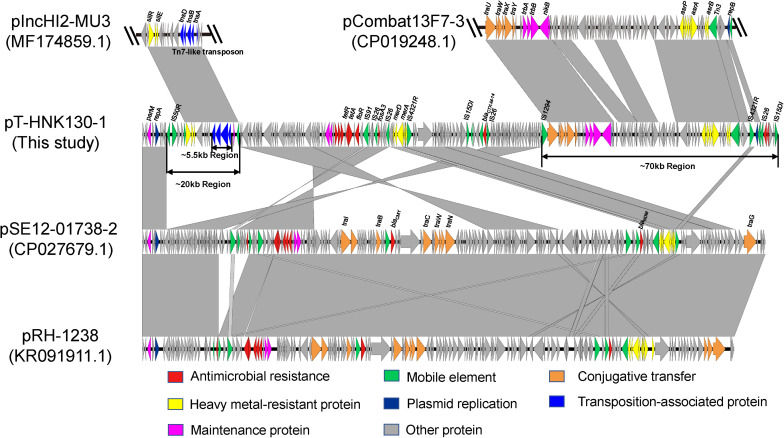
FIGURE 2.
Sequence linear comparison between pT-HNK130-1, pCombat13F7-3 (GenBank accession no. CP019248.1), pIncHI2-MU3 (accession no. MF174859.1), pSE12-01738-2 (accession no. CP027679.1), and pRH-1238 (accession no. KR091911). Gray shading indicates shared regions with a high degree of homology. Genes are represented by arrows and are colored depending on gene function as depicted. Genes are color coded as follows: dark blue, replication; green, mobile element; red, antimicrobial resistance; yellow, heavy metal–resistant protein; blue, transposition-associated protein; orange, conjugative transfer; rose red, maintenance protein; gray, other protein.

