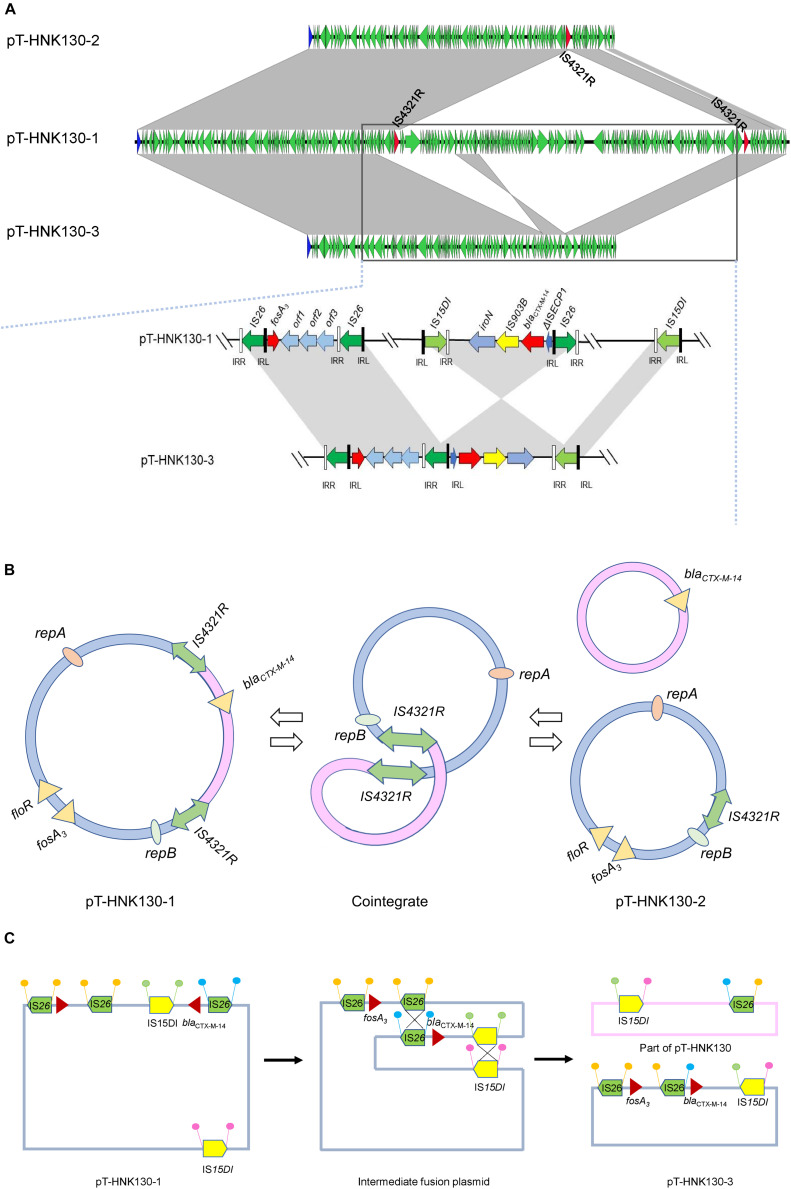
FIGURE 4.
(A) Complete sequence linear comparison of pT-HNK130-1, pT-HNK130-2, and pT-HNK130-3; (B) possible mechanism of pT-HNK130-2 formation; (C) possible mechanism of pT-HNK130-3 formation. Boxed arrows represent the position and transcriptional direction of ORFs. Regions of >99% identity are marked by gray shading.

