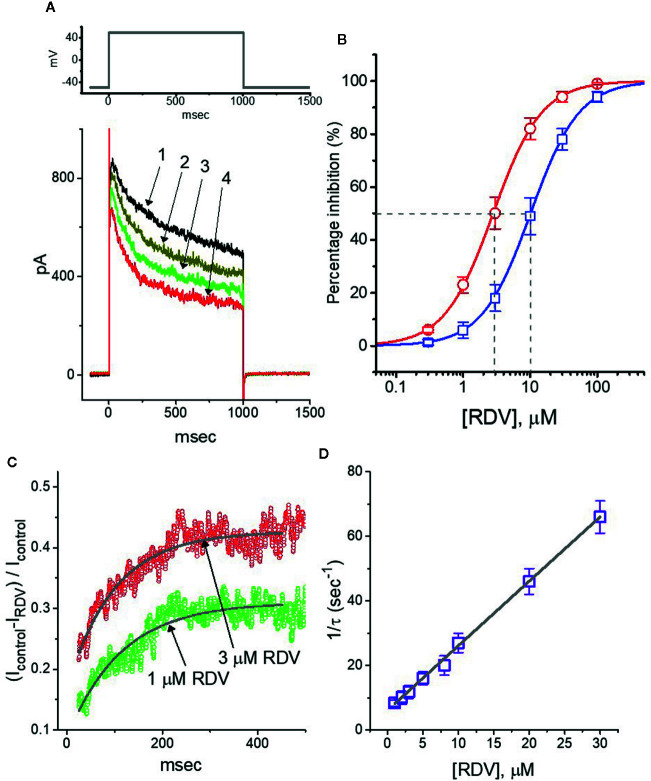
Figure 1.
Effect of RDV on delayed-rectifier K+ current (I K(DR)) in pituitary GH3 cells. Cells were bathed in Ca2+-free, Tyrode’s solution and the recording electrode was backfilled up with K+-containing solution. (A) Superimposed I K(DR) traces obtained in the control (1, i.e., RDV was not present), and during the exposure to 0.3 μM RDV (2), 1 μM RDV (3) or 3 μM RDV (4). The upper part is the voltage-clamp protocol applied to the cell. (B) Concentration-dependent inhibition of RDV on I K(DR) amplitude measured at the beginning (□) and end (○) of depolarizing command potential (mean ± SEM; n=8 for each point). I K(DR) amplitudes (i.e., transient or late component) in different RDV concentrations were taken at the beginning or end of depolarizing pulse for 1 sec from −50 to +50 mV. Continuous lines were well fitted with Hill equation as detailed in Materials and Methods. The IC50 value (as indicated by the vertical dashed line) measured in initial peak or late component of I K(DR) was yielded to be 10.1 or 2.8 μM, respectively. (C) Relative block (i.e., (I control-I RDV)/I control) of I K(DR) in the presence of 1 or 3 μM RDV. Smooth line in the presence of 1 or 3 μM RDV denotes the exponential fit with the time constant of 113.5 or 98.9 ms, respectively. (D) Relationship of the RDV concentration as a function of the rate constant (1/τ) (mean ± SEM; n=8 for each point). Based on minimal kinetic scheme described in Materials and Methods, the value of k +1 * or k -1 was estimated to be 2.01 s−1μM−1 and 6.12 s−1, respectively; and the K D value (k -1/k +1 *, i.e., dissociation constant) was resultantly yielded to be 3.04 μM.

