
Figure 4.
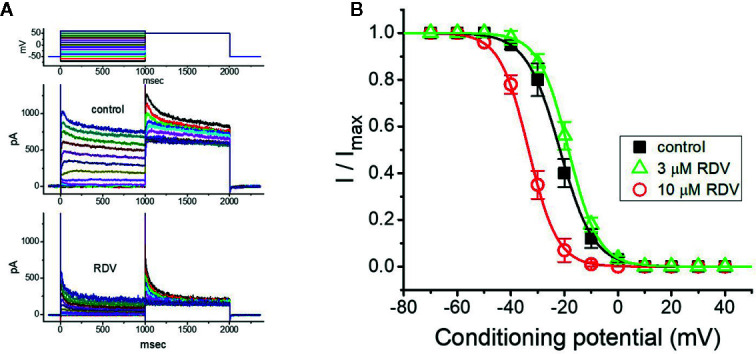
Effect of RDV on the steady-state inactivation curve of I K(DR) in GH3 cells. This set of experiments was undertaken with a two-step voltage protocol (as indicated in the uppermost part of (A). (A) Representative I K(DR) traces obtained in the absence (upper) and presence (lower) of 10 μM RDV. The voltage protocol applied is illustrated in the uppermost part. (B) Steady-state inactivation curve of I K(DR) in the control (■) and during exposure to 3 μM RDV (△) or 10 μM RDV (○) (mean ± SEM; n=8 for each point). Each curve noticeably overlaid on the data was fitted by Boltzmann equation detailed in Materials and Methods.