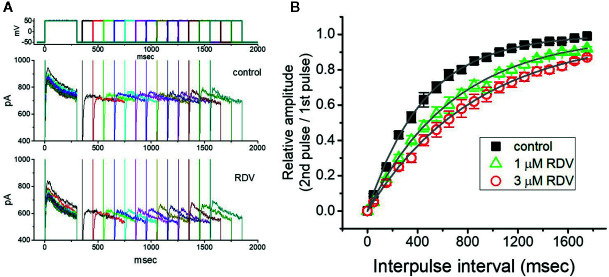
Figure 5.
Recovery from I K(DR) block produced by RDV. In this set of whole-cell recording experiments, GH3 cells, bathed in Ca2+-free, Tyrode’s solution, were depolarized from −50 to +50 mV with a duration of 300 ms and different interpulse durations were thereafter applied. (A) Superimposed I K(DR) traces in the absence (upper) and presence (lower) of 1 μM RDV. Voltage protocol used is denoted in the uppermost part of (A). (B) Time course of recovery from I K(DR) inactivation achieved in the control (■) and during exposure to 1 μM RDV (△) or 3 μM RDV (○). The recovery time course in the control, during exposure to 1 μM RDV, and that to 3 μM RDV was satisfactorily fitted to a single exponential with a time constant of 453, 687, and 867 ms, respectively. Each point in this Figure is the mean ± SEM (n=7 for each point).

