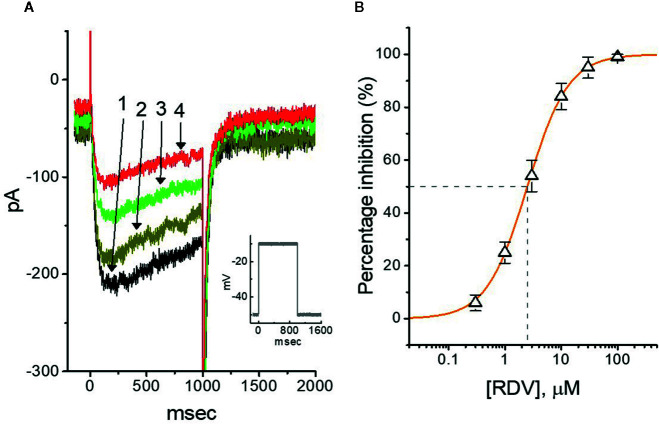
Figure 6.
Effect of RDV on M-type K+ current (I K(M)) in GH3 cells. The experiments were conducted in cells immersed in high-K+, Ca2+-free solution and the pipette used was filled with K+-containing solution. (A) Representative I K(M) traces elicited by 1-sec membrane depolarization from −50 to −10 mV (indicated in the Inset). Current trace labeled 1 is control and that labeled 2, 3 or 4 was obtained after the addition of 0.3 μM RDV, 1 μM RDV or 3 μM RDV, respectively. (B) Concentration-dependent relation of RDV effect on I K(M) amplitude in GH3 cells (mean ± SEM; n=9 for each point). The continuous line was accordingly fitted by a Hill function as described under Materials and Methods. The IC50 value (as indicated in the vertical dashed line) needed for RDV-induced depression of I K(M) was identified to be 2.5 μM.

