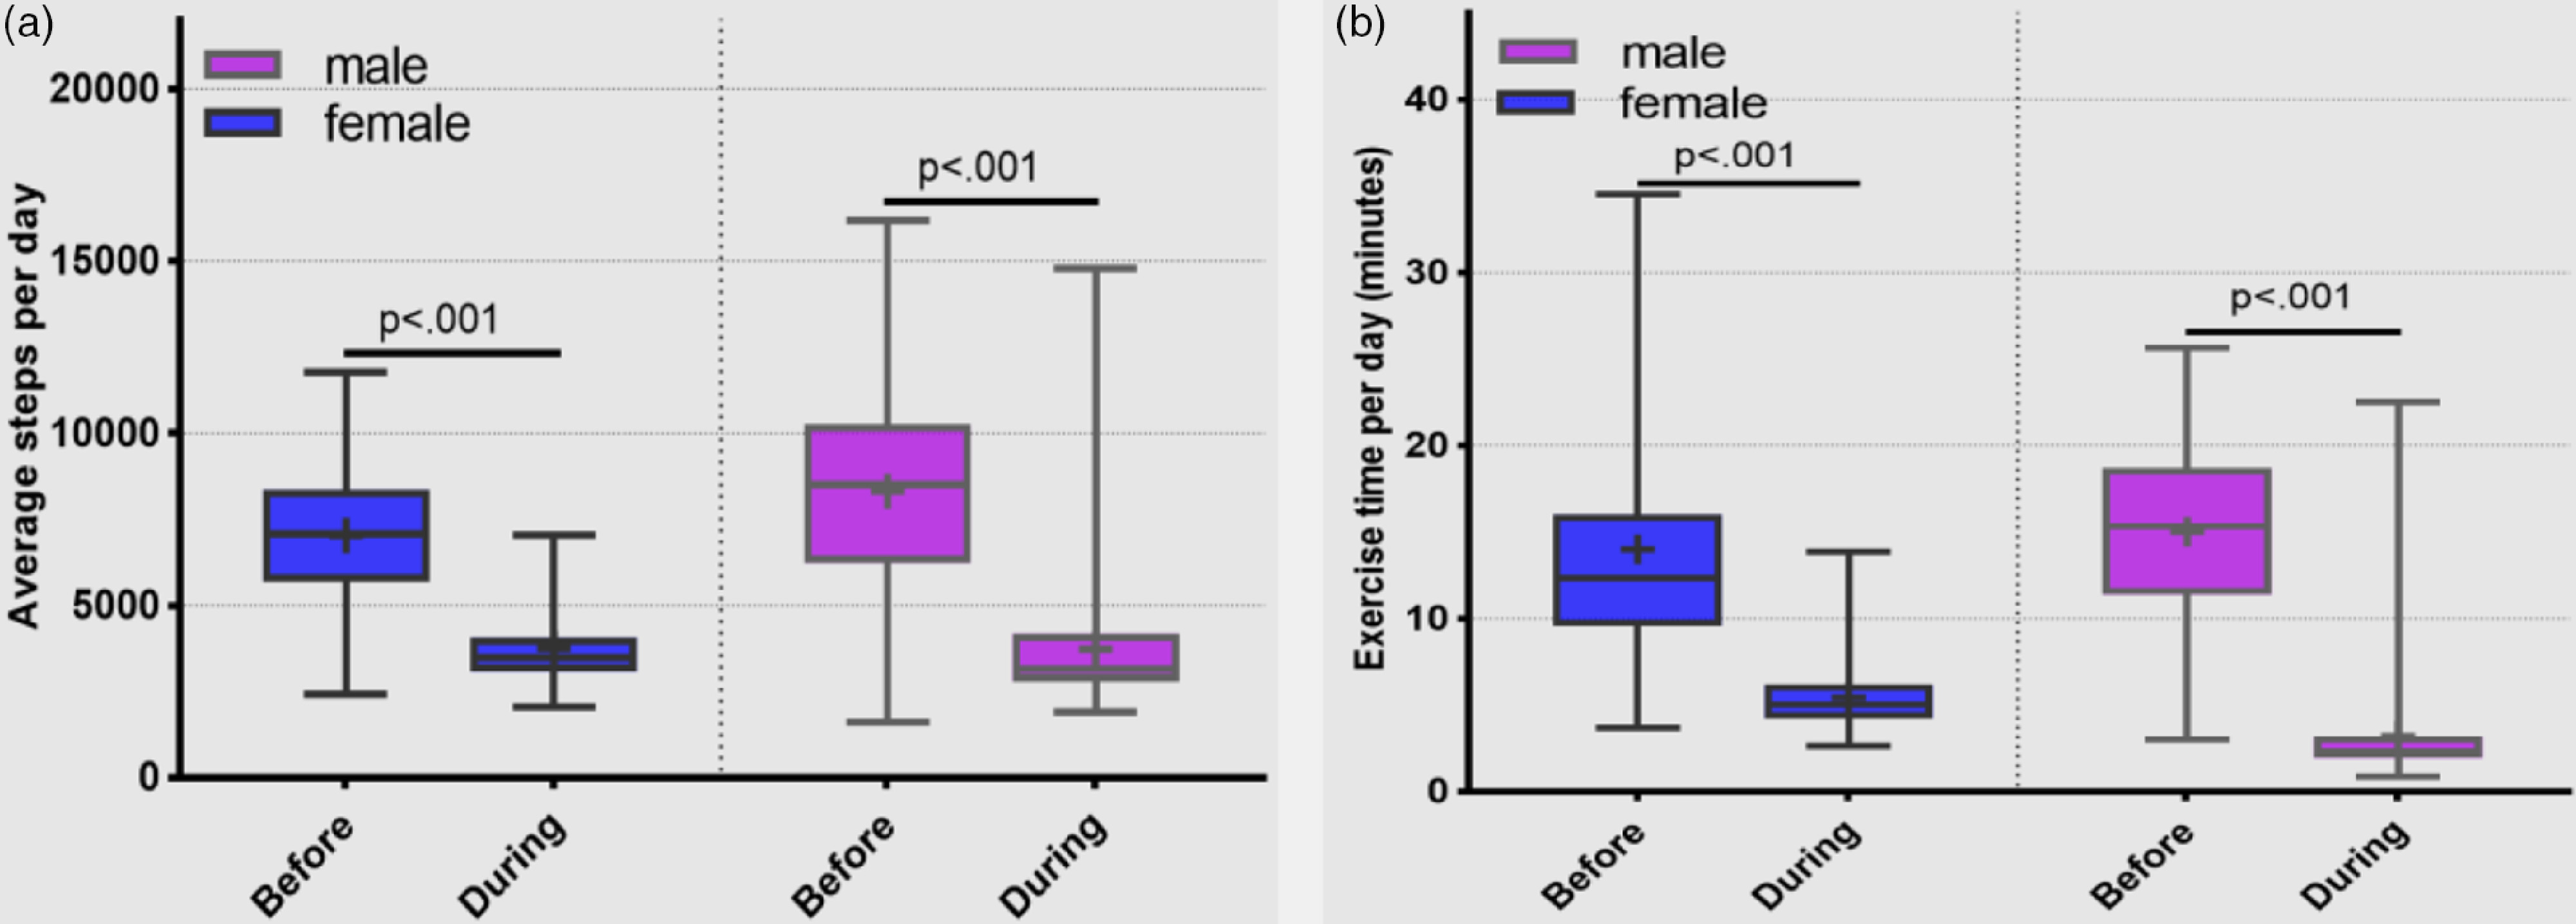
FIGURE 2.

(a) Average steps per day before and during the period of semi-lockdown by gender (statistical comparison by paired t test). (b) Average moderate- or vigorous-intensity exercise (minutes per day) before and during the period of semi-lockdown by gender.
Statistical comparison by Wilcoxon signed rank test.
