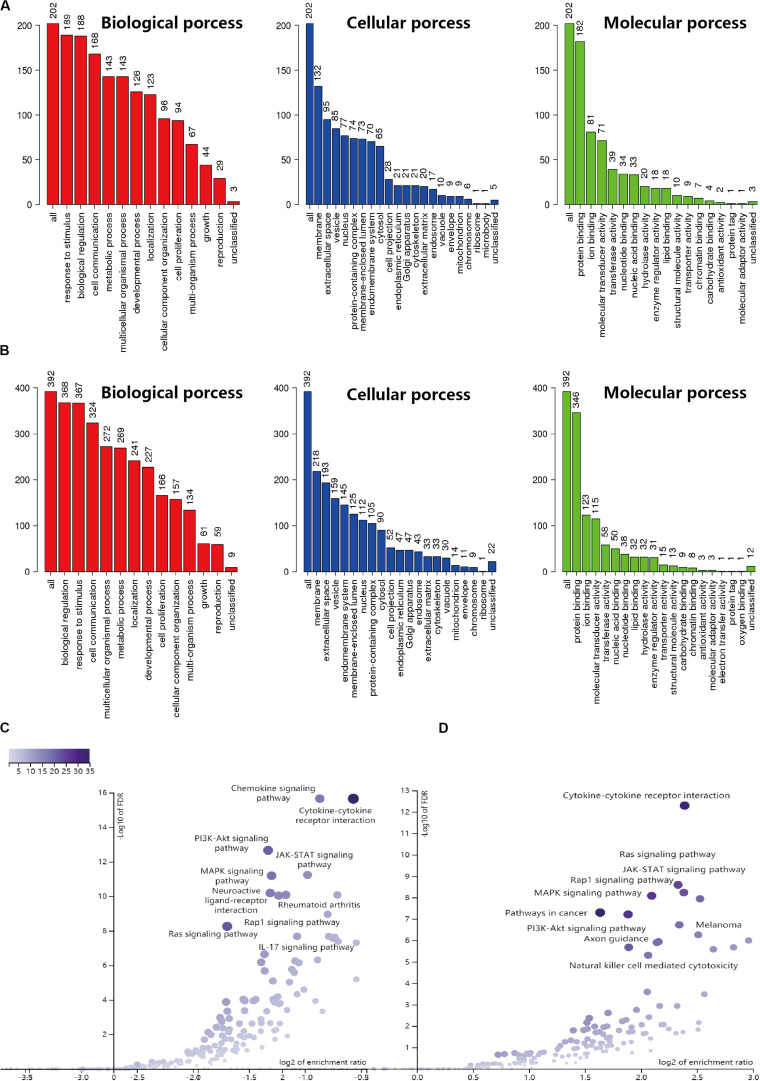
FIGURE 1.
GO and KEGG enrichment result for IRGs in CESC and UCEC. (A) GO enrichment analysis for CESC, the vertical axis represents the number of differentially expressed IRGs. (B) GO enrichment analysis for UCEC, the vertical axis represents the number of differentially expressed IRGs. (C) Volcano of KEGG enrichment result for CESC. (D) Volcano of KEGG enrichment result for UCEC.

