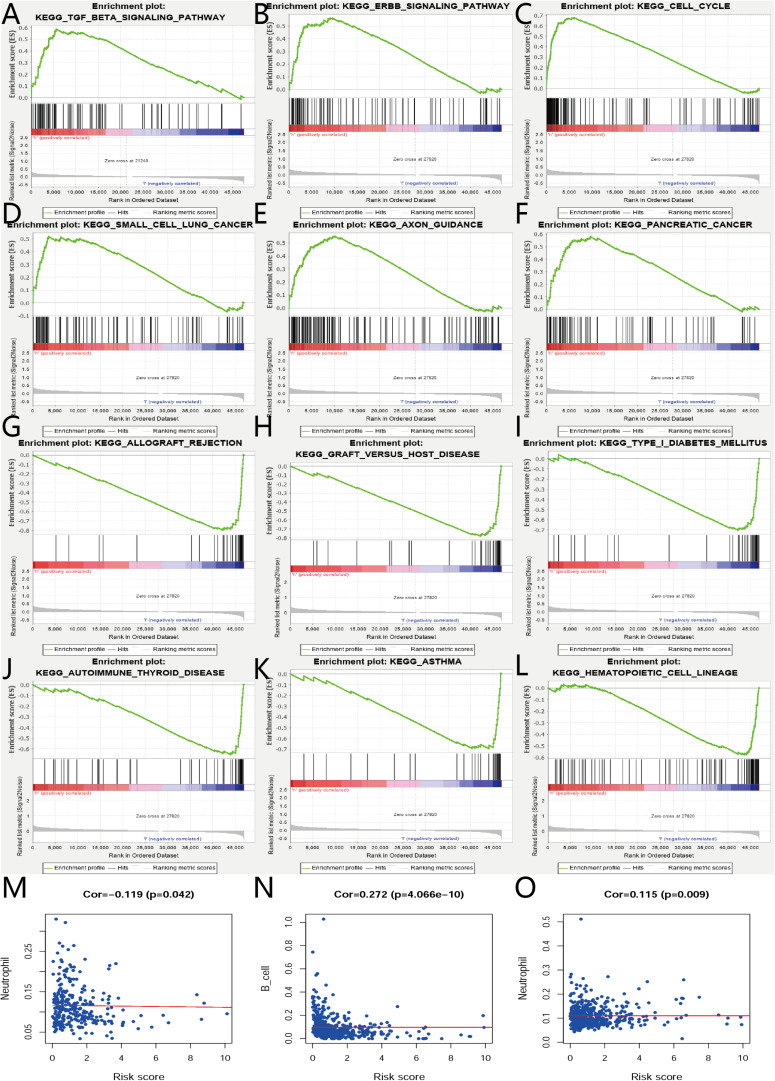
FIGURE 6.
GSEA and relationships between IRGs and tumor infiltrating immune cells index in CESC and UCEC. (A) GSEA results of high risk group in cervical cancer. (B–F) GSEA results of high risk group in endometrial cancer. (G–L) GSEA results of low risk group in endometrial cancer. (M) Relationships between risk score of IRGs model in cervical cancer and tumor infiltrating immune cells index. (N,O) Relationships between risk score of IRGs model in endometrial cancer and tumor infiltrating immune cells index.

