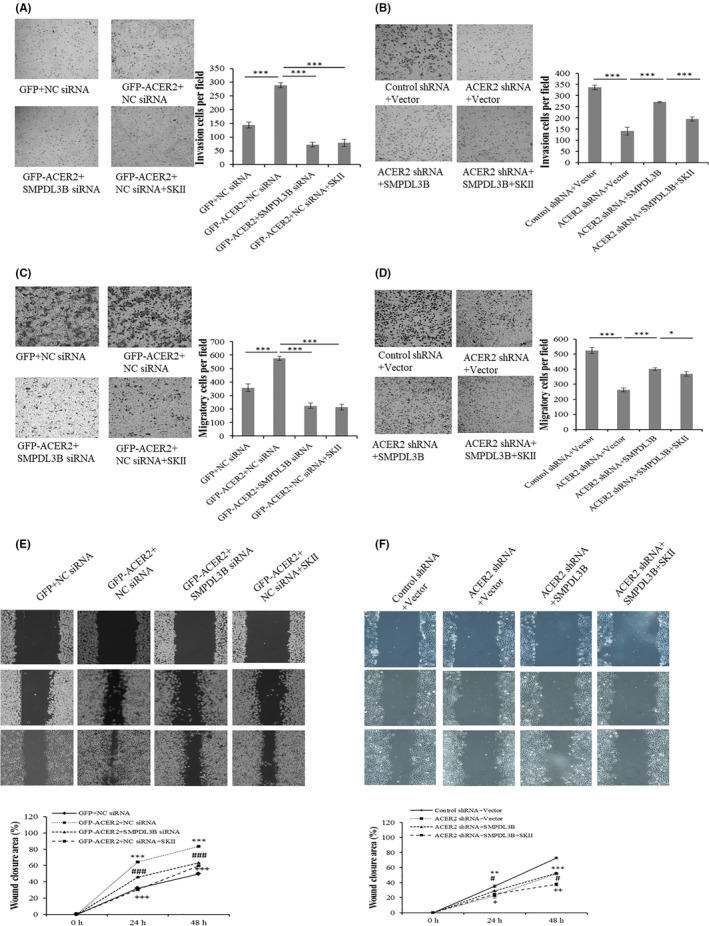
Figure 12.

The ACER2/SMPDL3B axis regulates HCC cell invasion and migration via S1P. Stable ACER2 overexpression (A, C, E) or knockdown (B, D, F) Huh‐7 cells were transfected with the siRNA (A, C, E) or indicated plasmids (B, D, F) for 48 h during which SKII was added. Then, transwell assays (A‐D) and wound‐healing assays (E, F) were performed. The histograms (A‐D) represent the mean values of invasive and migrated cells per field (from at least 5 fields, mean ± SD); cell number was counted using ImageJ software (*P < .05; ***P < .001) (A‐D). The wound closure area (scale bar: 50 μm) was also quantified using ImageJ (E, F). Error bars represent the SD from 3 independent experiments, and statistical significance were analyzed using Student t test (# or +P < .05; ** or ++P < .01; ***, ### or +++P < .001)
