
Figure 2.
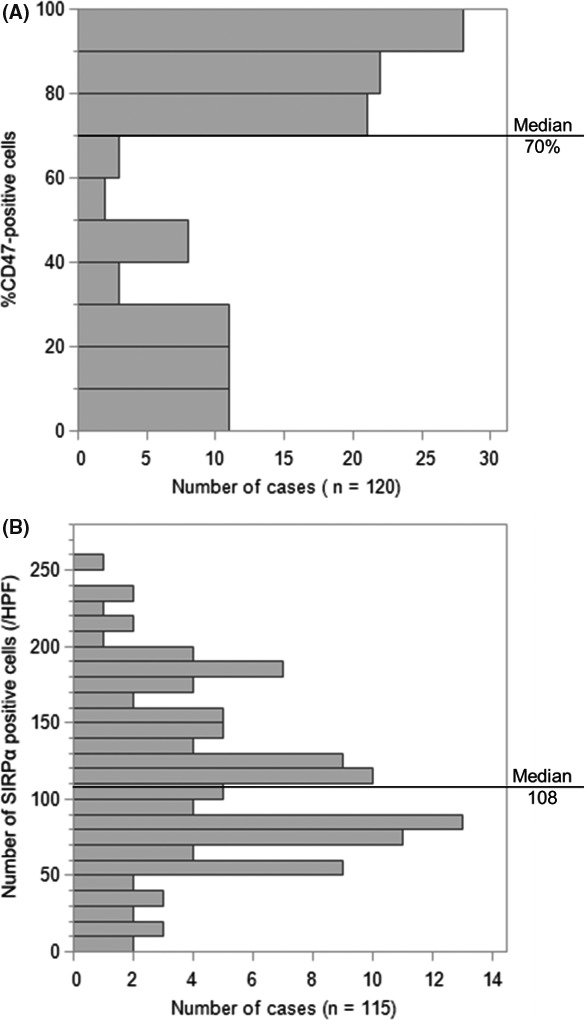
Histograms for immunohistochemistry in diffuse large B‐cell lymphoma. A, Distributions of the rate of CD47‐positive tumor cells. B, Distributions of the number of signal‐regulatory protein‐α (SIRPα)‐positive stromal cells. Cut‐off points are shown as the median. HPF, high power field