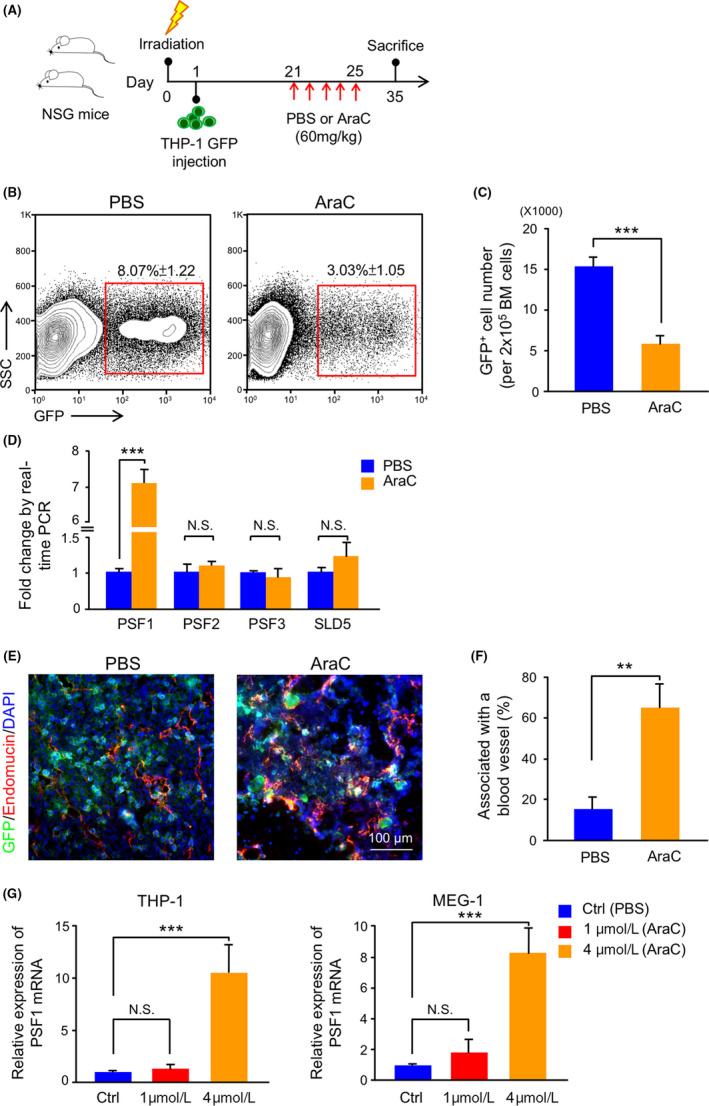
Figure 2.

Drug resistance of leukemia cells in a mouse leukemia model using human leukemia cells. A, Experimental scheme for THP‐1 GFP cells transplantation and AraC treatment model. For details, see Section 2. B, Flow cytometric analysis of GFP+ cells in bone marrow (BM) from PBS‐treated or AraC‐treated mice. The percentage of GFP+ cells within total cells in the BM is shown in the red box (n = 6 per group). Error bars represent means ± SD. C, Quantitative evaluation of the number of GFP+ cells observed in (B) (n = 6 per group). Error bars represent means ± SD; ***P < .001. D, Quantitative real‐time PCR analysis of GINS member mRNA expression in GFP+ cells in BM from PBS‐treated or AraC‐treated mice (n = 6). Error bars represent means ± SD; ***P < .001, NS, not significant. E, Immunofluorescence staining of GFP (green), endomucin (red), and DAPI (blue) in BM sections from PBS‐treated or AraC‐treated mice. Scale bar, 100 μm. F, Percentage of GFP+ cells adjacent to blood vessels in BM sections from PBS‐treated or AraC‐treated mice. Error bars represent means ± SD; **P < .01 (5 random fields of 6 independent BM sections). G, Quantitative real‐time PCR analysis of PSF1 mRNA expression in THP‐1 and MEG‐1 cells after stimulation with PBS (Ctrl) or AraC (1 and 4 μmol/L) (n = 3). Error bars represent means ± SD; ***P < .001, NS, not significant
