Figure 6.

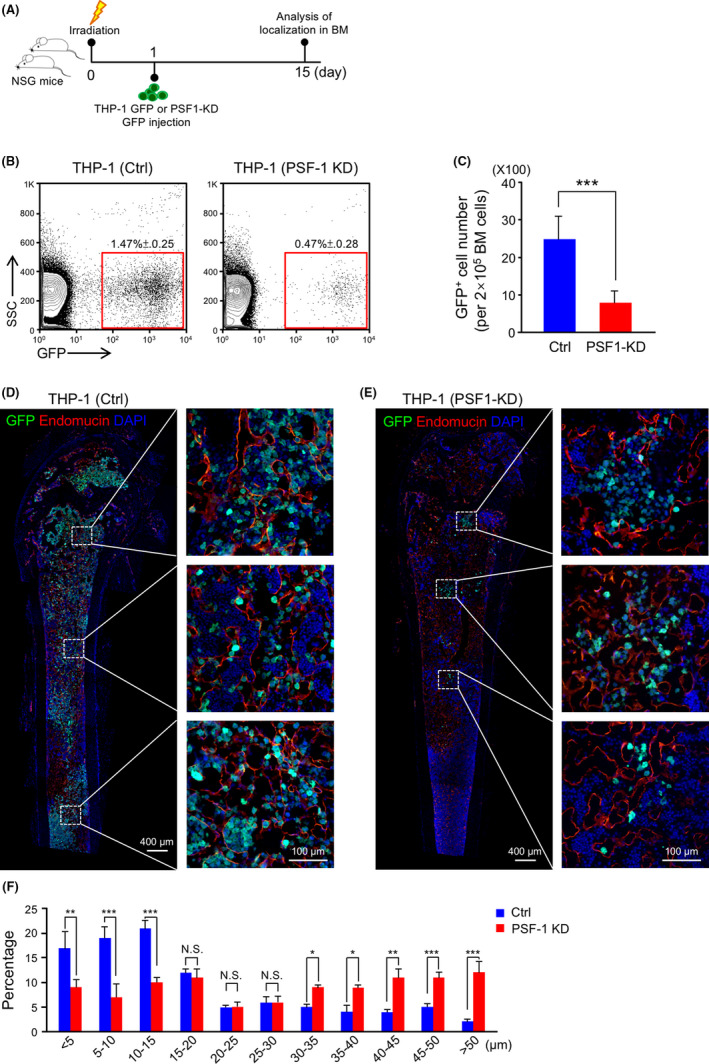
Knockdown (KD) of PSF1 changes the distance between leukemia cells and blood vessels in bone marrow (BM). A, Experimental scheme for THP‐1 GFP (Ctrl) or THP‐1 GFP (PSF1‐KD) cells used in the BM‐T model. B, Flow cytometric analysis of GFP+ cells in BM from Ctrl or PSF1‐KD transplanted mice. The percentage of GFP+ cells within all cells in the BM is shown in the red box (n = 4 per group). Error bars represent means ± SD. C, Quantitative evaluation of the number of GFP+ cells observed in (B) (n = 4 per group). Error bars represent means ± SD; ***P < .001. D, E, Immunofluorescence staining of GFP (green) and endomucin (red) in BM sections from Ctrl (D) or PSF1‐KD (E) recipient mice. Endomucin was selected as an endothelial cell marker in BM. DAPI (blue) was used to detect nuclei and dashed boxes indicate areas shown at higher magnification. Scale bars, 400 μm and 100 μm (inset). F, Distances between Ctrl or PSF1‐KD GFP+ cells and blood vessels in the metaphysis and diaphysis area of recipient mouse BM. Error bars represent means ± SD; *P < .05, **P < .01, ***P < .001, NS, not significant (5 random fields of 6 independent BM sections)
