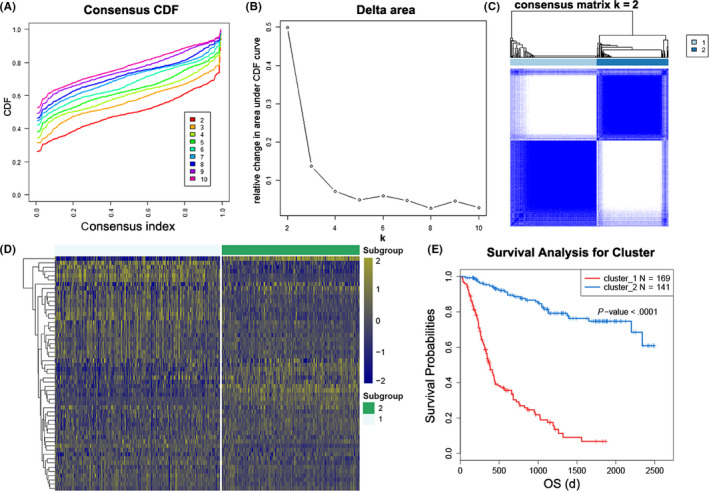
FIGURE 1.

Consensus clustering for ATP metabolism‐related genes in glioma patients from CGGA dataset. A, Consensus clustering cumulative distribution function (CDF) for k = 2 to k = 10. B, Relative change in area under CDF curve for k = 2 to k = 10. C, Consensus clustering matrix of 310 samples from CGGA dataset for k = 2. D, Heat map of 2 clusters defined by the top 55 variable expression genes. E, Kaplan‐Meier (K‐M) survival curve of patients in 2 clusters
