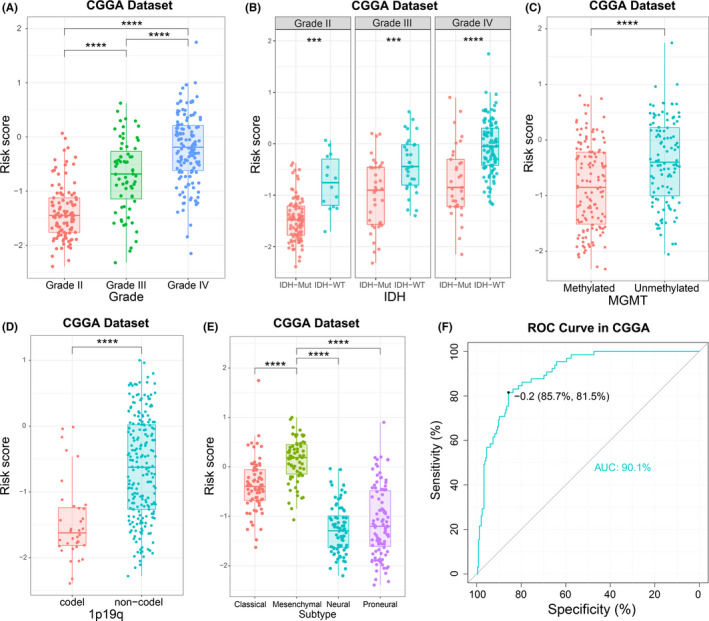
FIGURE 3.

Association between pathologic characteristics and the ATP metabolism‐related signature in the CGGA dataset. A‐E, Distribution of the risk score in glioma patients stratified by WHO grade, isocitrate dehydrogenase (IDH) mutation status, O6‐methylguanine‐DNA methyl‐transferase (MGMT) promoter methylation, 1p/19q codeletion status and TCGA molecular subtypes. F, Receiver operating characteristic (ROC) curves predicted ATP metabolism as a biomarker of mesenchymal subtype glioma. *** P < .001, **** P < .0001
