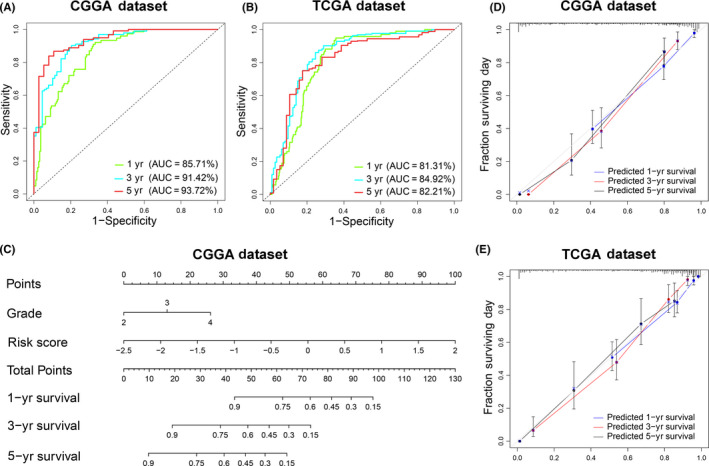
FIGURE 5.

An individualized prediction model for overall survival (OS) of patients with glioma. A, B, The time receiver operating characteristic (ROC) curve analyses to predict 1‐, 3‐, and 5‐y OS according to risk score in CGGA and TCGA datasets. C, A nomogram was developed by integrating the signature risk score with the clinicopathologic features in the CGGA cohort. D, E, Calibration curves of nomogram for predicting OS at 1 y (blue line), 3 y (red line) and 5 y (black line) in the CGGA and TCGA datasets
