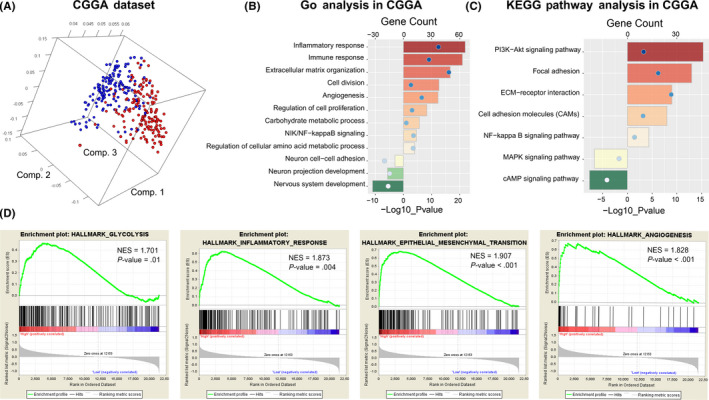
FIGURE 6.

Functional analysis of the ATP metabolism‐related signature in the CGGA dataset. A, Principal components analysis of whole gene expression data between high‐risk and low‐risk groups. B, C, GO and KEGG pathway analyses were performed via the DAVID website to explore the functional annotation of the risk signature. D, GSEA analysis was used to explore the biological functions and pathways that were significantly enriched in patients with high‐risk score
