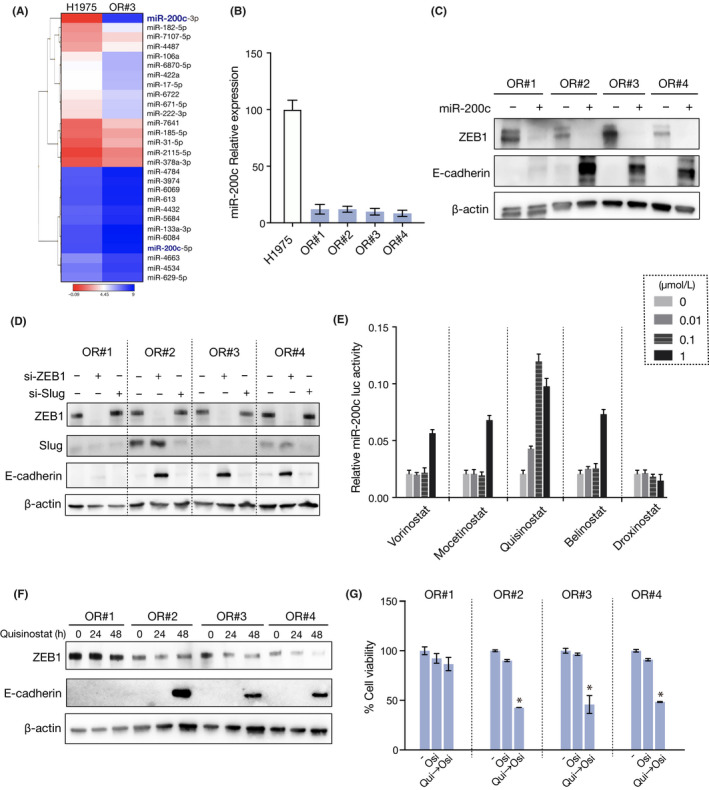
FIGURE 3.

Quisinostat reversed epithelial‐mesenchymal transition by upregulating microRNA (miR)‐200c expression through inhibition of ZEB1. A, Heatmap representation of miRNA array data showing the expression levels of miRNAs in decreasing order of fold change more than 2 between parental H1975 and OR#3 cells (n = 2). B, Relative expression of miR‐200c was measured in H1975 parental cells and resistant clones (n = 3). Error bars represent SEM. *P < .0001. C, H1975‐resistant clone cells were treated with a miR‐200c mimic. Change in ZEB1 and E‐cadherin expression was analyzed by western blotting. D, ZEB1 or Slug siRNA was introduced into H1975‐resistant clone cells, and cell lysates were analyzed by western blotting with the indicated Abs 48 h later. E, Change of miR‐200c promoter activity in OR#3 cells treated with 5 HDAC inhibitors (n = 3). Error bars represent SEM. *P < .01. F, Change in ZEB1 and E‐cadherin expression in resistant clones treated with 0.03 µmol/L quisinostat was analyzed by western blotting. G, Resistant clones were pretreated with 0.03 µmol/L quisinostat for 48 h, followed by treatment with osimertinib for 72 h. Cell viability was measured using MTT assay (n = 3). Error bars represent SEM. *P < .0001
