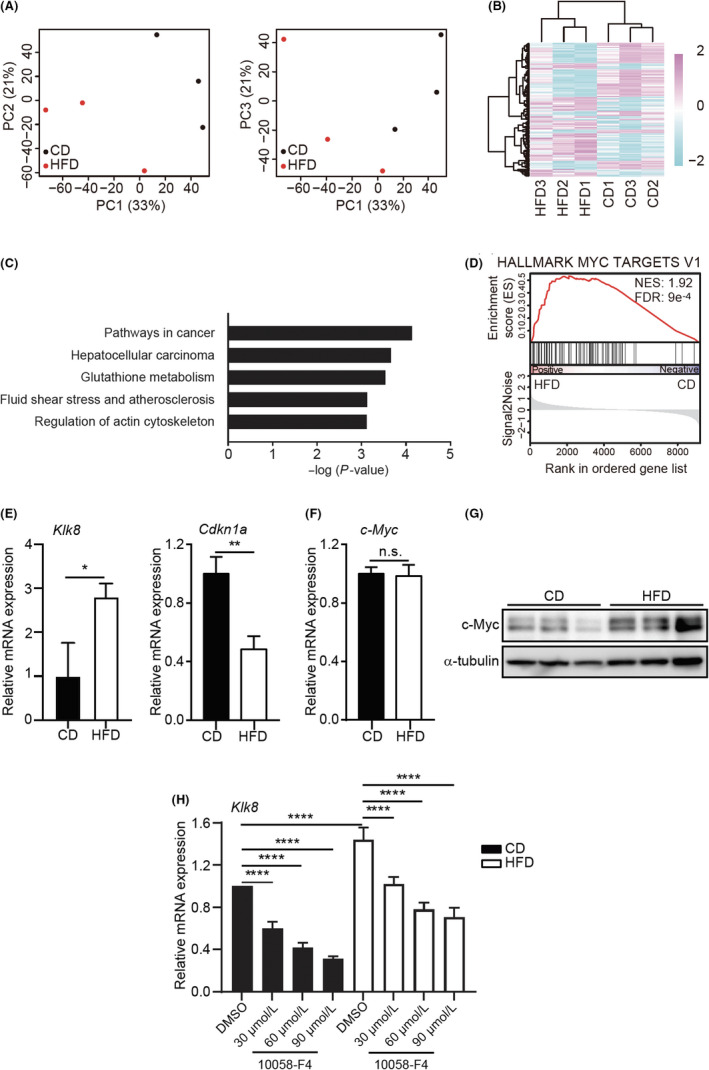
FIGURE 3.

High‐fat diet (HFD) induces altered expression of the c‐Myc target genes and increases the c‐Myc protein level. A, Principal component (PC) analyses of gene expression profile in HFD‐mouse mammary epithelial cells (MMECs) (N = 3) and control diet (CD)‐MMECs (N = 3). B, Heat map of clustering analysis of top 100 up‐ or downregulated genes in HFD‐MMECs (N = 3) and CD‐MMECs (N = 3) by weighted average differentiation. C, Enrichr analysis of Kyoto Encyclopedia of Genes and Genomes pathways significantly (adjusted P < .05) enriched in the top 100 upregulated genes in HFD‐treated MMECs. D, Gene set enrichment of MYC signature (h.all.v7.0.symbols.gene.) in HFD‐MMECs vs CD‐MMECs. E, mRNA expression of indicated genes in CD‐MMECs and HFD‐MMECs. F, mRNA expression of c‐Myc (N = 3). G, Immunoblotting of c‐Myc protein in CD‐MMECs and HFD‐MMECs (N = 3). α‐Tubulin was used as a loading control. H, mRNA expression of Klk8 gene in CD‐MMECs and HFD‐MMECs after treatment with Myc inhibitor 10058‐F4 or DMSO for 24 h in the indicated concentrations (N = 3 for each group). Data are mean ± SE, *P < .05, **P < .01, ****P < .0001 (Student’s t test and 2‐way ANOVA). FDR, false discovery rate; NES, net enrichment score; n.s., non‐significant
