
FIGURE 4.
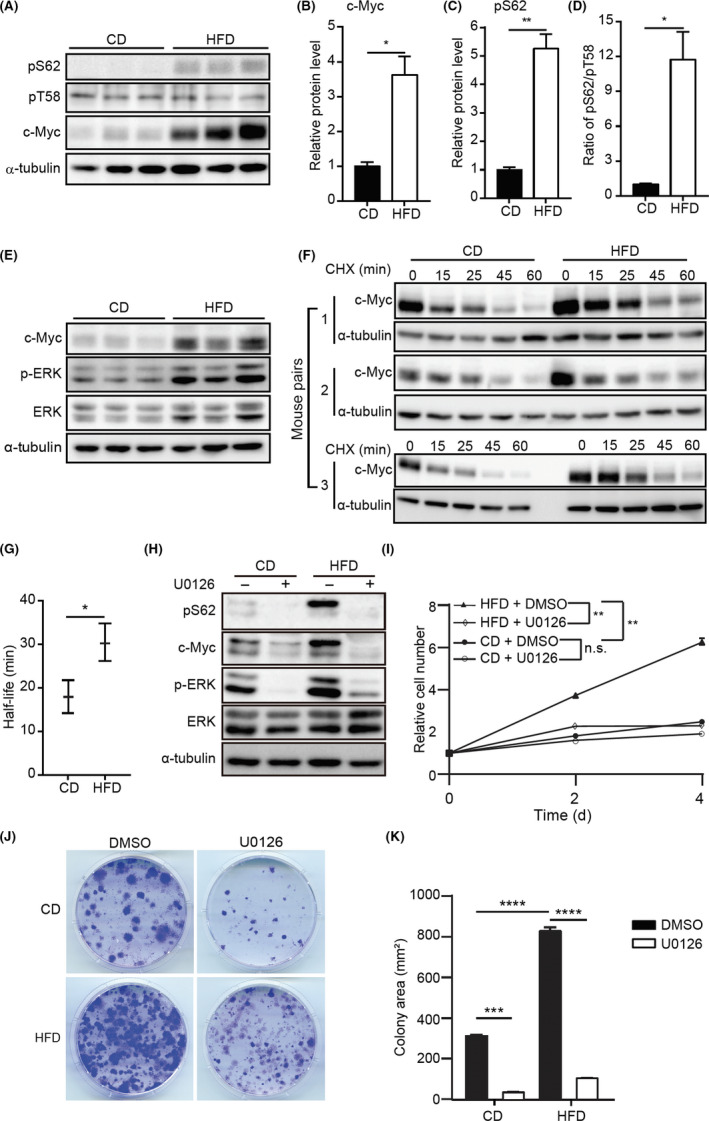
High‐fat diet (HFD) stabilizes c‐Myc. A, Immunoblotting (IB) of c‐Myc phosphorylation at serine (S62) (pS62) and threonine (T58) (pT58) in control diet (CD)‐mouse mammary epithelial cells (MMECs) and HFD‐MMECs (N = 3). B, C, Quantitative analysis of expression of indicated proteins. D, Quantitative analysis of the pS62/pT58 using the IB data in (A). E, IB of indicated proteins in CD‐MMECs and HFD‐MMECs (N = 3). F, Cycloheximide (CHX) chase assay to determine the half‐life of c‐Myc in CD‐MMECs and HFD‐MMECs (N = 3). Cells were treated with 10 µg/mL CHX for the indicated time periods. G, Quantitative analysis of c‐Myc half‐life in CD‐MMECs and HFD‐MMECs (N = 3). H, IB of indicated proteins in CD‐MMECs and HFD‐MMECs in the presence of DMSO or nmol/L ERK inhibitor U0126 for 1 h. I, WST‐1‐based cell proliferation assay of CD‐MMECs and HFD‐MMECs treated with DMSO or nmol/L U0126. Medium was replenished every 24 h (N = 3 for each group). J, Colony formation assay of CD‐MMECs and HFD‐MMECs in the presence of DMSO or nmol/L U0126 for 14 days. Cell culture medium was replenished every 72 h. K, Quantitative analysis of the colony area in (J) (N = 3 for each group). α‐Tubulin was used as a loading control. ImageJ‐NIH software was used to quantify IB band intensities. Data are the mean ± SE. *P < .05, **P < .01, ***P < .001, ****P < .0001 (Student’s t test and 2‐way ANOVA) n.s., non‐significant