Figure 2.

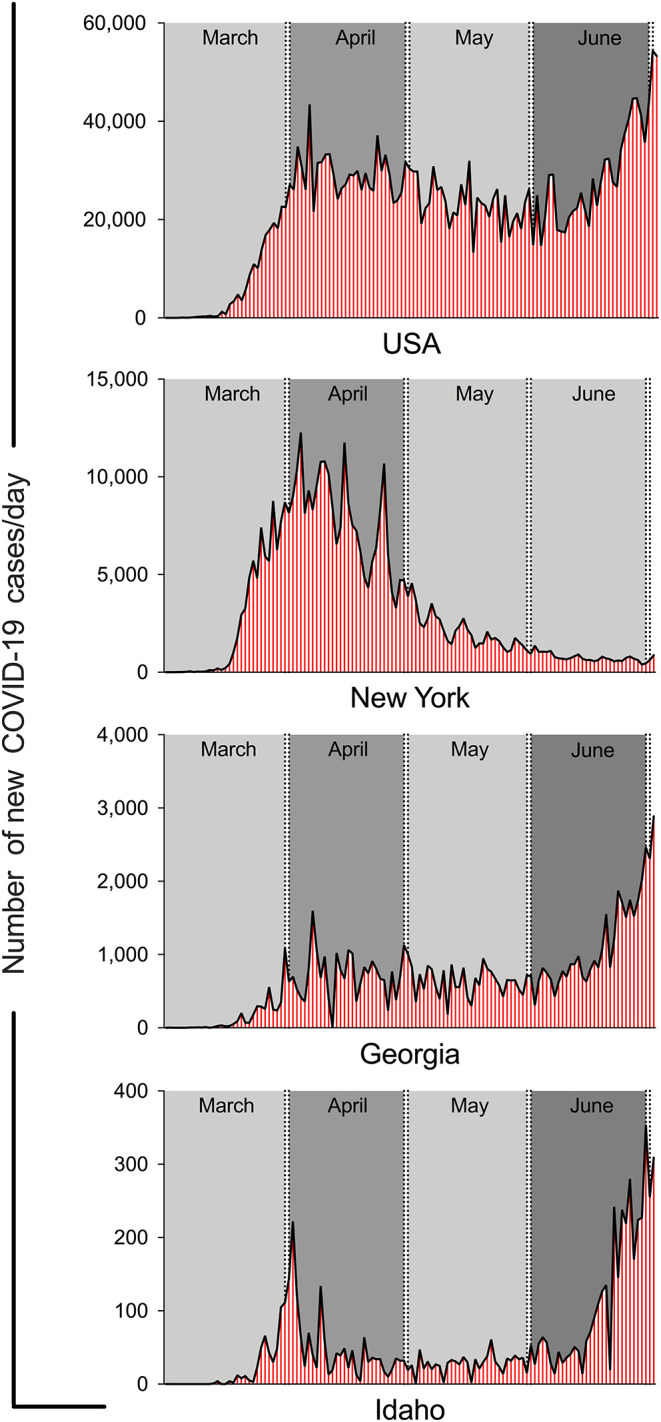
The wax and wane in new cases of COVID-19 per day in USA, New York, Georgia and Idaho. The graphs were generated using the online data form CDC and John Hopkins web sites.

The wax and wane in new cases of COVID-19 per day in USA, New York, Georgia and Idaho. The graphs were generated using the online data form CDC and John Hopkins web sites.