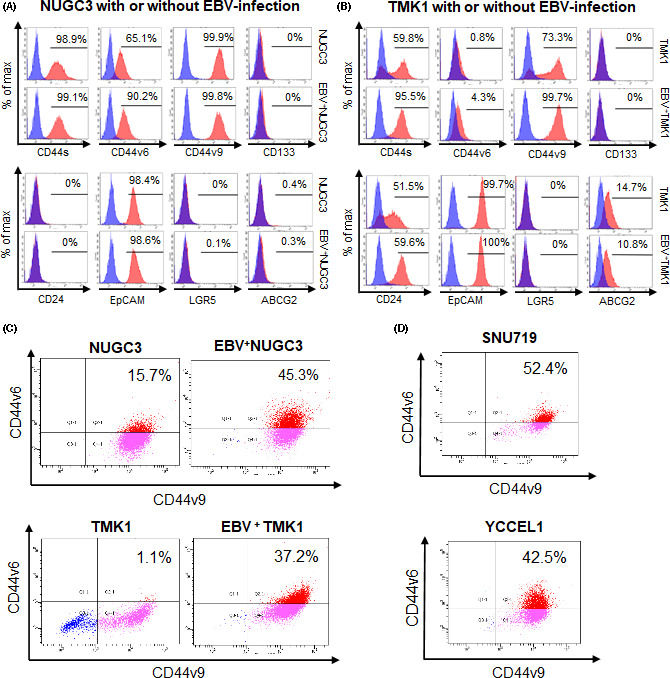
FIGURE 1.

Cancer stem cell markers in gastric cancer cell lines experimentally or naturally infected with Epstein‐Barr virus (EBV). A, FACS analysis of cancer stem cell markers in NUGC3 gastric cancer cells with and without EBV infection. Isotype control is indicated as a blue peak. The percentage of the positive fraction is shown in each graph. B, FACS analysis of cancer stem cell markers in TMK1 gastric cancer cells with and without EBV infection. C, Dual color analysis of CD44v6 and CD44v9 expression in NUGC3 and TMK1 gastric cancer cells with and without EBV infection. Horizontal axis, Alexa Fluor488‐CD44v9; vertical axis, phycoerythrin (PE)‐CD44v6. D, Dual color analysis of CD44v6 and CD44v9 expression in EBV‐associated gastric carcinoma cell lines SNU719 and YCCEL1. Horizontal axis, Alexa Fluor 488‐CD44v9; vertical axis, PE‐CD44v6
