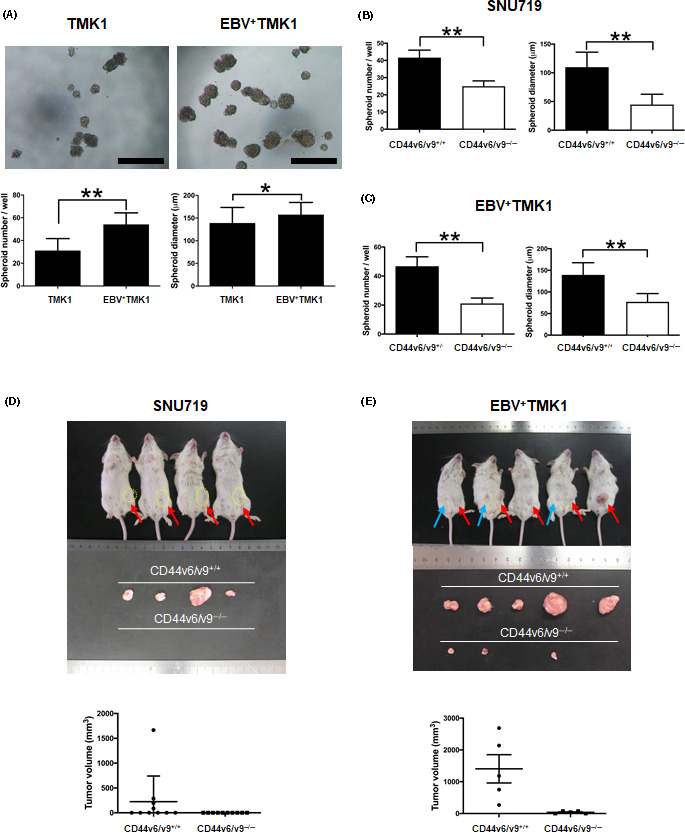
FIGURE 2.

Cancer stem cells in Epstein‐Barr virus (EBV)‐associated gastric cancer are enriched for CD44v6/v9+/+ cells. A, Spheroid formation ability of TMK1 and EBV+ TMK1 cells. Upper panels, representative images of spheroid colonies derived from TMK1 and EBV+ TMK1 cells (7 days). Lower panels, number and diameter of the spheres (mean ± SD; **P < .01, Mann‐Whitney U test). B, Spheroid formation assay of CD44v6/v9+/+ and CD44v6/v9−/− fractioned cells of SNU719 cells. A total of 10 000 cells were seeded in each well. Measurement of the number (left) and diameter (right) of spheroid colonies after 10 days (mean ± SD; *P < .05, **P < .01, Mann‐Whitney U test). C, Spheroid formation assay of CD44v6/v9+/+ and CD44v6/v9−/− fractioned cells of EBV+ TMK1 cells. A total of 500 cells were seeded in each well. Measurement of the number (left) and diameter (right) of spheroid colonies after 10 days (mean ± SD; *P < .05, **P < .01, Mann‐Whitney U test). D, Tumor formation of CD44v6/v9+/+ and CD44v6/v9−/− cells from SNU719 cells in vivo. A total of 90 000 cells embedded in Matrigel were inoculated s.c. into SCID mice (n = 10 per group). Measurement of the tumor volume after 67 days (red arrows indicate tumors derived from CD44v6/v9+/+ cells). Lower graph shows volume (mean ± SEM). E, Tumor formation of CD44v6/v9+/+ and CD44v6/v9−/− cells from EBV+ TMK1 in vivo. A total of 150 000 cells embedded in Matrigel were inoculated s.c. into SCID mice (n = 5 per group). Measurement of tumor volumes after 34 days (blue arrows indicate tumors derived from CD44v6/v9−/− cells, and red arrows indicate tumors derived from CD44v6/v9+/+ cells). Lower graph shows tumor volume (mean ± SEM; P = .0079, Mann‐Whitney U test)
