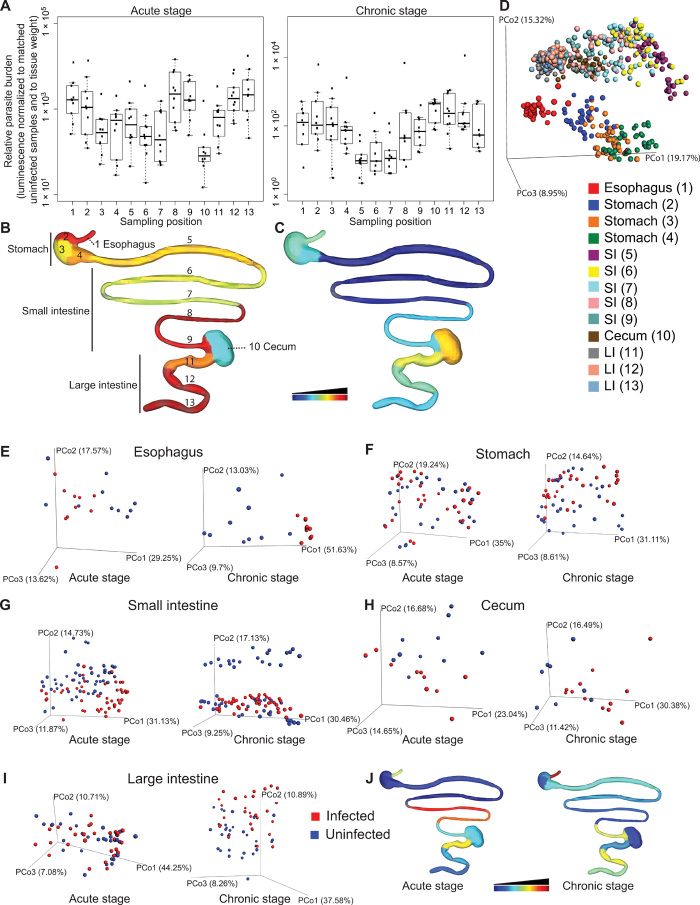
Fig. 1. Spatial impact of T. cruzi infection is reflected by spatial modulation of the tissue small-molecule profile.
C3H/HeJ male mice (n = 5 per group and replicate) were mock-infected or infected with 1000 luminescent T. cruzi strain CL Brener trypomastigotes in two biological replicates. GI samples were collected 12 and 89 days after infection. (A) Parasite burden at each sampling site. To correct for variations in sample size and background signal, luminescence counts were normalized to signal from matched uninfected samples and to sample weight, for each sampling position. (B and C) Median normalized luminescent signal, at each sampling site, 12 days after infection (B) and 89 days after infection (C). Common logarithmic scale for (B) and (C), scaled from lowest luminescent signal (dark blue) to highest signal (dark red). (D) PCoA analysis showing separation between sampling sites in terms of overall chemical composition, even within a given organ (positive mode, all time points combined, Bray-Curtis-Faith distance metric). (E to I) PCoA analysis showing chemical composition differences (positive mode analysis) between infected and uninfected samples in the esophagus (E), stomach (F), small intestine (G), cecum (H), and large intestine (I). (J) R2 at each sampling site [common logarithmic scale, scaled from lowest R2 (dark blue) to highest R2 (dark red)]. PCo, principal coordinate (e.g., PCo1, principal coordinate 1).

