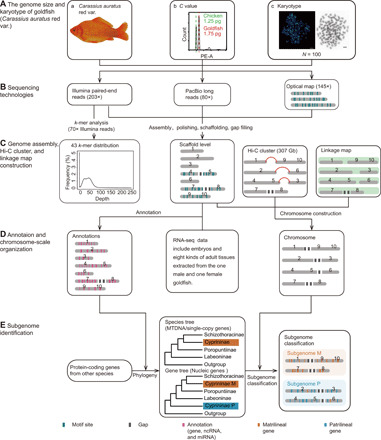
Fig. 1. Workflow of genome assembly and subgenome identification.

(A) Genome size and karyotype of goldfish. (a) Image of a gynogenetic goldfish (C. auratus var.). Photo credit: Shaojun Liu, Hunan Normal University, China. (b) Diagram of C value. The X axis presents the fluorescence index, and the Y axis presents the frequency of cells. Sample/calibration ratio equals the peak X value of the calibration sample divided by X value at the peak of the target sample. The first sharp peak with green dashed line displays the X axis and cell frequency of chicken blood, and the second one with red dashed line represents the X axis and cell frequencies of goldfish. C value of sample is sample/calibration ratio × calibration sample’s C value. (c) Goldfish have 100 chromosomes and 100 signals after the chromosomes are stained with DNA probe (probe A) [9468-bp fragment of 36 copies of a repetitive 263-bp fragment; adopted from Liu et al. (11)]. (B) Sequencing technologies for primary assembly. (C) Genome assembly, Hi-C cluster, and genetic map construction. Genome size assessment by k-mer analysis is performed by 40× Illumina paired-end reads after the primary assembly. Next, scaffolds are clustered into 50 pseudochromosomes by using Hi-C data obtained by chromosomes; the genetic map was constructed by using the data of Kuang et al. (27) (D) Annotation and chromosome-scale organization. Annotation of scaffolds was performed using a combination of ab initio prediction, transcript evidence gathered from RNA-seq of embryos and eight kinds of adult tissues (gonads, brain, liver, spleen, kidney, eye, epithelium, and fin), and homologous genes information from five fish genomes, by using EVidence Modeler (EVM). Final set of 50 pseudochromosomes was generated after pairwise validation among Hi-C clustering results, genetic map, and collinearity analyses. (E) Subgenome identification. After extracting the homologous genes of goldfish and other species, the species tree is constructed by using single-copy genes from 10 genomes. Gene trees were constructed by defining homologous gene clusters using whole-genome sequences/transcripts from 10 cyprinid species of Cyprininae (C. auratus, Cyprinus carpio), Labeoninae (Labeo rohita), Poropuntiinae (Poropuntius huangchuchieni), Schizothoracinae (Schizothorax oconnori, Schizothorax waltoni, Schizothorax macropogon, and Schizothorax kozlovi), Danio rerio, and Ctenopharyngodon idellus. After comparing the species tree and nucleic gene trees, the matrilineal (clustered with Schizothorax) and patrilineal markers from the gene trees were labeled back to 25 pairs of pseudochromosomes. The origin of pseudo-chromosomes was identified by most of the supported markers.
