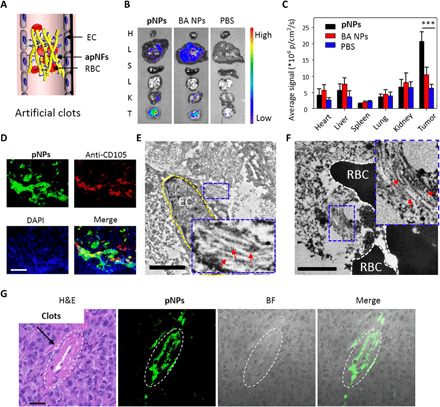
Fig. 5. Characterization of artificial clots in vivo.

(A) Schematic representation of apNFs trapping RBCs that formed artificial clots in tumor vessels. (B) Ex vivo fluorescence images of tissues from MDA-MB-231 tumor–bearing mice treated with pNPs through intravenous injection at 72 hours after injection. The tissues from up to down are those of the heart, liver, spleen, lungs, kidney, and tumor. High fluorescence intensity is detected in the tumor tissue. (C) Corresponding quantitative analysis of (B). ***P < 0.001. (D) CLSM images of the tumor slices from MDA-MB-231 tumor–bearing mice treated with pNPs through intravenous injection after 72 hours, which were stained with anti-CD105 antibody and 4′,6-diamidino-2-phenylindole (DAPI). The pNPs (green) appear in the vessel domain (red) of the tumor, and the nuclei are denoted as blue. Scale bar, 25 μm. (E and F) Bio-TEM images of tumor slices from MDA-MB-231 tumor–bearing mice treated with pNPs through intravenous injection after 72 hours. The yellow dotted line denotes ECs, and the red arrows indicate apNFs. The black parts are the RBCs. The inserted pictures were magnified nanofibers. Scale bars, 2.0 μm. (G) Hematoxylin and eosin (H&E) staining and CLSM images of tumor slices from MDA-MB-231 tumor–bearing mice treated with pNPs through intravenous injection after 72 hours. The merged clots from H&E and the apNFs from green fluorescence reveal that apNFs form artificial clots, which may block blood. Scale bar, 50 μm. ***P < 0.001.
