
Fig. 2. Characterization of nanomotors.
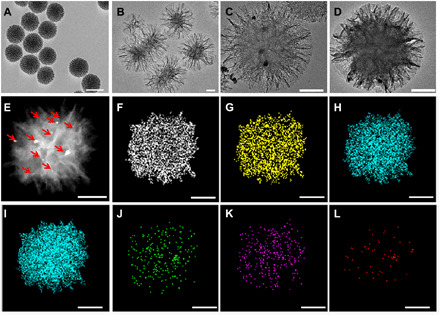
TEM images of (A) MS, (B) MMS, (C) MMNM, and (D) MMNM/PM; HAADF image of (E) MMNM/PM; and the corresponding TEM-mapping images of (F) C, (G) N, (H) O, (I) Si, (J) P, (K) S, and (L) Pt (scale bar, 100 nm).
Official websites use .gov
A
.gov website belongs to an official
government organization in the United States.
Secure .gov websites use HTTPS
A lock (
) or https:// means you've safely
connected to the .gov website. Share sensitive
information only on official, secure websites.
TEM images of (A) MS, (B) MMS, (C) MMNM, and (D) MMNM/PM; HAADF image of (E) MMNM/PM; and the corresponding TEM-mapping images of (F) C, (G) N, (H) O, (I) Si, (J) P, (K) S, and (L) Pt (scale bar, 100 nm).