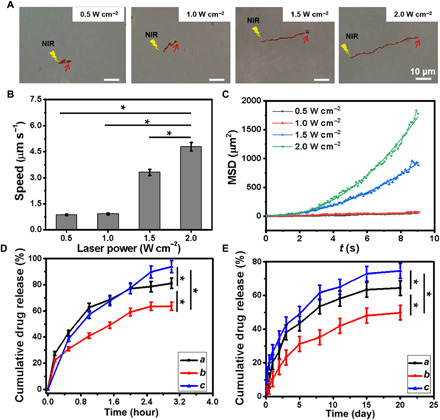
Fig. 3. Motion and drug release behavior of the nanomotors under different conditions.

(A) Time-lapse images displaying the tracking trajectories, (B) speeds of MMNM/PM nanomotor under different NIR power densities (9 s), and (C) their corresponding parabolic fitting for MSD plots (y = ax2 + bx + c) (movie S1). (D) UK and (E) Hep release profiles in vitro under different conditions (a, MMNM/Hep/UK; b, MMNM/Hep/UK/PM; c, MMNM/Hep/UK/PM + NIR). An asterisk denotes statistical significance between bars (*P < 0.05) using one-way analysis of variance (ANOVA). Experimental data are means ± SD of samples in a representative experiment (n = 3).
