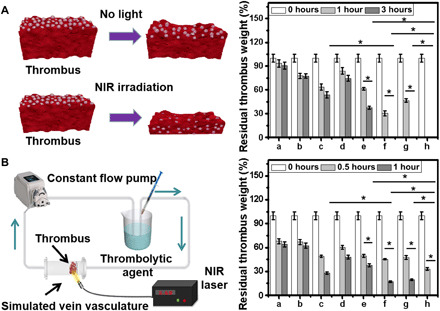
Fig. 4. Thrombolytic effect of the nanomotor in vitro.

(A) Schematic illustration of static thrombolysis model and the residual thrombus weight in static thrombolysis model. (B) Schematic illustration of dynamic thrombolysis model and residual thrombus weight under different conditions (a, phosphate-buffered saline + NIR; b, Hep; c, UK; d, MMNM+NIR; e, MMNM/Hep + NIR; f, MMNM/UK + NIR; g, MMNM/Hep/UK + NIR; and h, MMNM/Hep/UK/PM + NIR). An asterisk denotes statistical significance between bars (*P < 0.05) using one-way ANOVA analysis. Experimental data are means ± SD of samples in a representative experiment (n = 3).
