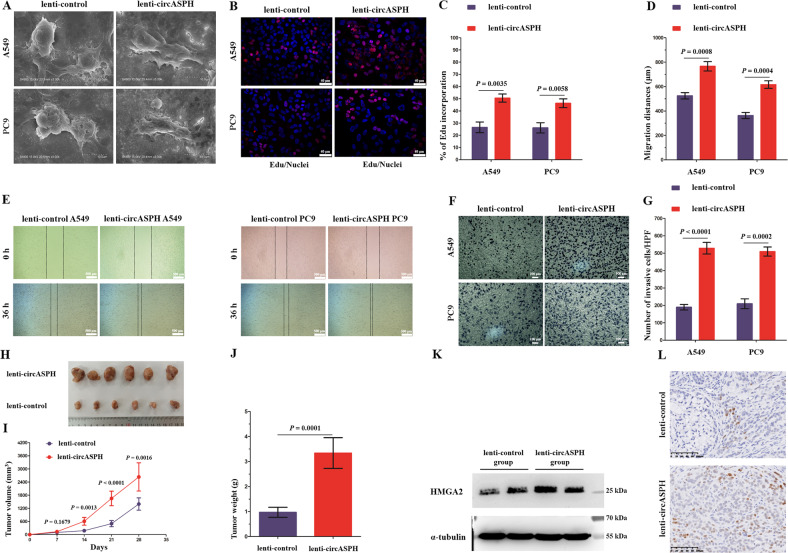
Fig. 2. The oncogenic effects of circASPH in vitro and in vivo.
a The morphologic changes in A549 and PC9 cells overexpressing circASPH were observed using a scanning electron microscopy assay. b, c DNA synthesis assessed using an EdU assay in the lenti-circASPH cells and control cells. Nuclei were stained with Hoechst 33342 (blue). The quantified data are presented as the percentage of EdU-incorporated cells. Log2 transformation was applied to deal with the ratio results and to obtain the normally distributed data. Then, T test was used to compare the difference between groups. d, e The migration of A549 and PC9 cells was significantly increased by circASPH overexpression. The migration distances (μm) of A549 and PC9 cells were quantified. f, g The invasion of A549 and PC9 cells was apparently increased by circASPH overexpression. The quantified data are presented as the number of invading cells per HPF. HPF high-power field. h–j Xenograft tumor models show that tumors grown from the circASPH-overexpressing cells were bigger than those grown from the control cells. k Western blot analysis of the levels of HMGA2 protein in the xenograft tumors. l IHC staining of the HMGA2 protein in the xenograft tumors. Every cell test was carried out in triplicate, and n = 3 for each cell group.

