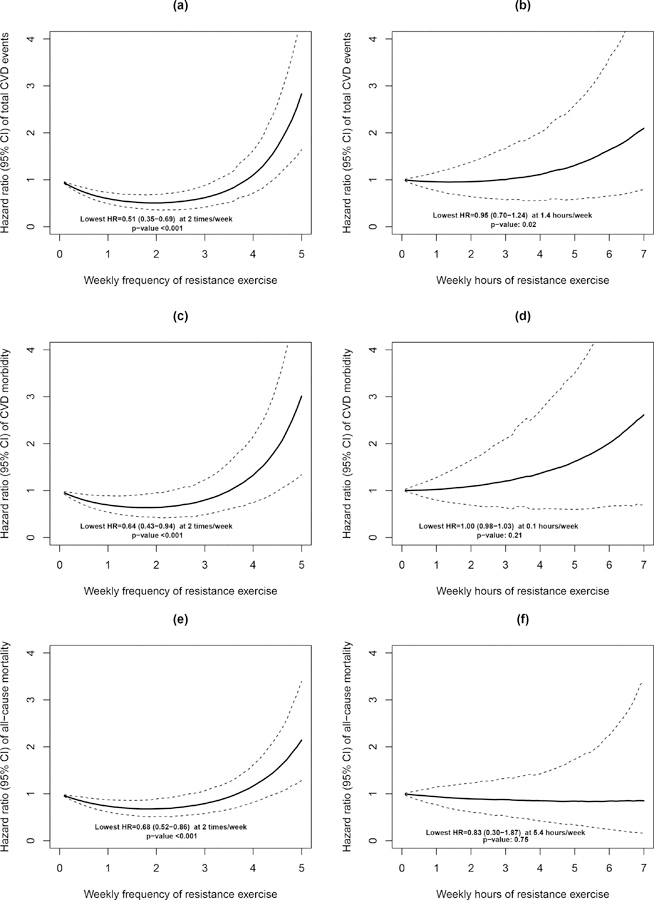
FIGURE 2— The Dose-response Relationship between Resistance Exercise and Risk of Total CVD Events, CVD Morbidity, and All-Cause Mortality.

Dotted lines represent 95% confidence intervals for the hazard ratios. Quadratic trend p value is presented in each figure. Models were adjusted for baseline examination year, age (years), sex, baseline smoking status (current smoker or not), alcohol consumption (heavy drinker or not), parental history of cardiovascular disease (yes or no), body mass index (kg/m2), aerobic exercise (average physical activity ≥500 MET-minutes/week or not), hypertension (yes or no), diabetes (yes or no), and hypercholesterolemia (yes or no). Figure (a), (c) and (e) shows significant U-shape associations between weekly frequency of resistance exercise with three outcomes. The lowest risk of CVD and all-cause mortality is attained at resistance exercise of two times/week. Figure (b) shows significant quadratic association between weekly hours of resistance exercise with risk of total CVD events. Figure (d) and (e) shows weekly hours of resistance exercise has no significant quadratic association with risk of CVD morbidity and all-cause mortality.
